
Figure 5.
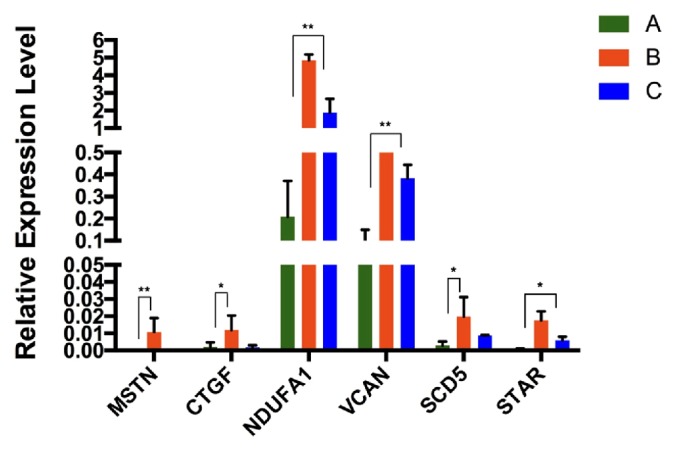
Differentially expressed genes in CCs from high-quality embryo compared with CCs from low-quality embryo and unfertilized embryo by RT-PCR. Group A, gene expression levels in CCs from oocytes yielding high-quality embryos (n=20). Group B, gene expression levels in CCs from oocytes yielding low-quality embryos (n=20). Group C, gene expression levels in CCs from oocytes failing to form embryos (n=20). ∗P value < 0.05; ∗∗P value < 0.01. Gene expression levels in group B and group C were both higher than the levels in group A.