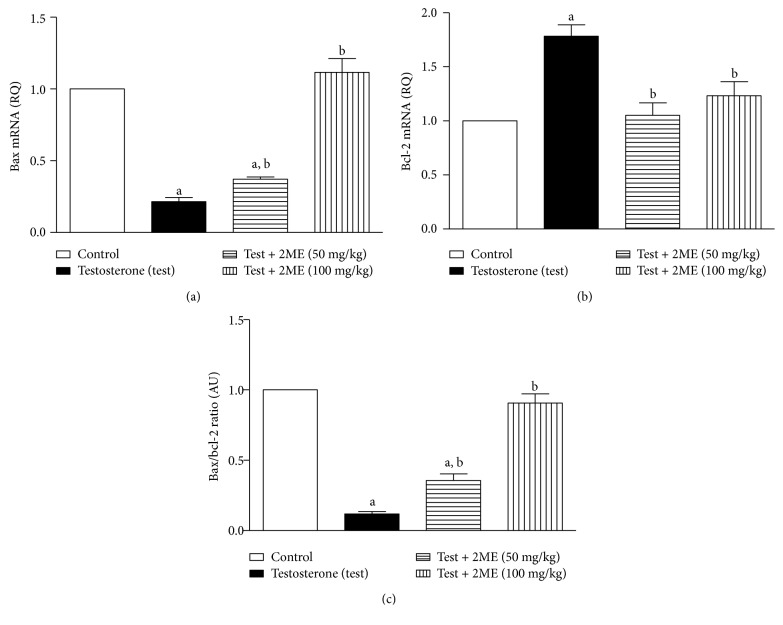
Figure 3.
Effects of 2ME treatment on prostatic mRNA levels of Bax (a) and Bcl-2 (b) expressed as relative quantification (RQ) compared to the control group. (c) Bax/Bcl-2 ratio. Data are presented as the mean ± SD (n = 3). a or b: significantly different from control or testosterone-treated groups, respectively, at p < 0.05 using one-way ANOVA followed by Tukey's post hoc test.

