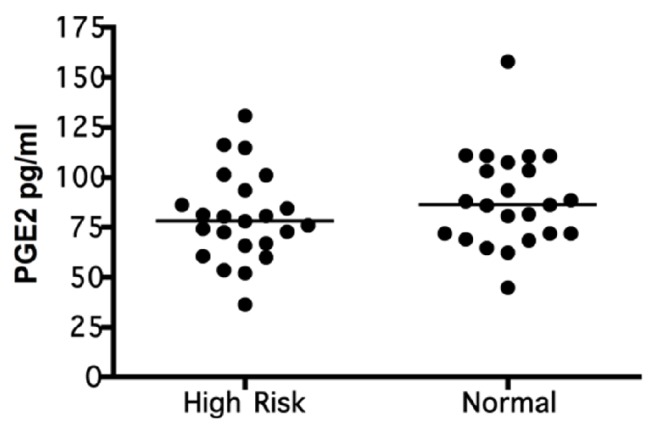
Figure 1.

PGE 2 levels by risk. Expression of PGE2 in case group patients at risk of preterm delivery (High Risk) and the control group not at risk (Normal), n=23 per group. The PGE2 levels was quantified by ELISA and compared between groups by a bivariate analysis. The data are represented by the median for each group.
