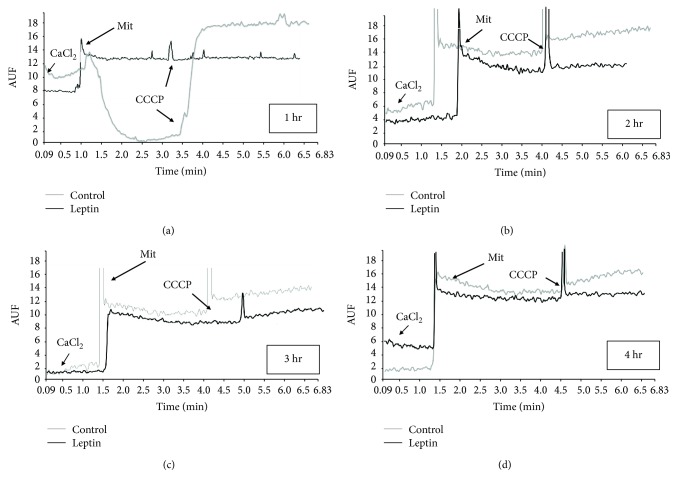
Figure 2.
Calcium transported by mitochondria. (a) Plot of calcium internalization during active oxidative phosphorylation for control (gray) and leptin-treated (black) mitochondria. Arrows indicate the time points when the indicated additions were made. The reaction was stopped by the addition of CCCP to induce a complete release of calcium. (b), (c), and (d) are representative plots of control and leptin-treated mitochondria after 2, 3, and 4 hours of perfusion, respectively. CCCP: carbonyl cyanide-m-chlorophenyl hydrazone; Mit: mitochondria; AUF: arbitrary units of fluorescence.

