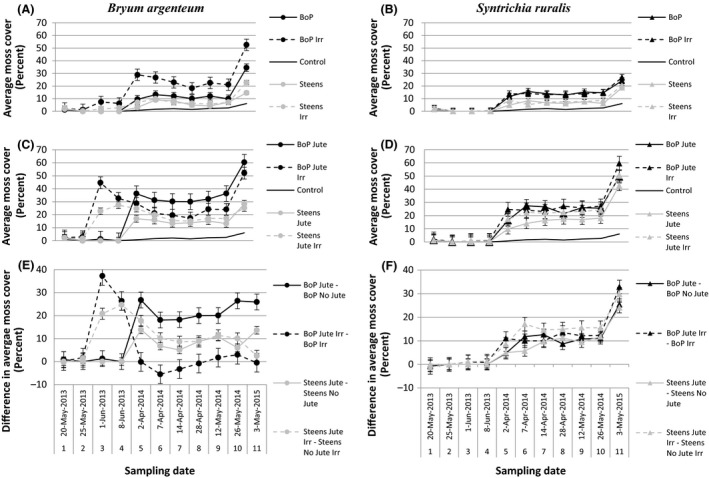
Figure 1.

Average moss cover (percent) from treatment experiment on spring inoculations, by sampling date, over the course of the study. Graphs in the first column (A, C, and E) are of Bryum argenteum, and graphs in the second column (B, D, and F) are of Syntrichia ruralis. Graphs in the first row (A, B) show the effect of spring inoculation with and without irrigation. Graphs in the second row (C, D) show the effect of jute net with and without irrigation. Graphs in the third row (E, F) show a difference in moss cover with and without jute net between otherwise similar treatment. Abbreviations are as follows: BoP‐Birds of Prey, Idaho population, Steens, Oregon population, Jute‐jute net, and Irr‐irrigation. Weeks 1 and 5 did not include all possible replicates, but cover is averaged among all flats surveyed in that week. Weeks 1 and 5 were not used in the analysis because they were not complete datasets. Week 2 was not used because of a large number of zeros which broke assumptions of normality and symmetrical variance. Please note that there are gaps in our sampling between weeks 4 and 5 and weeks 10 and 11
