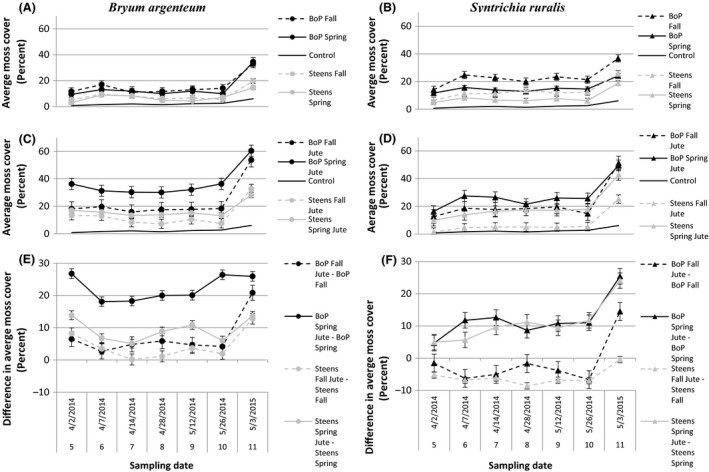
Figure 2.

Average moss cover (percent) from season experiment on spring and fall inoculations by sampling date, over the course of the study. Graphs in the first column (A, C, and E) are of Bryum argenteum, and graphs in the second column (B, D, and F) are of Syntrichia ruralis. Graphs in the first row (A, B) show moss cover from both seasons of inoculation. Graphs in the second row (C, D) show moss cover with jute net treatment from both seasons of inoculation. Graphs in the third row (E, F) show a difference in moss cover with and without jute net between otherwise similar treatments. Abbreviations follow Fig. 1. Week 5 was not used in analysis because it did not include all possible replicates, but cover shown above is averaged among all flats surveyed in that week. Please note that there are gaps in our sampling between weeks 4 and 5 and weeks 10 and 11
