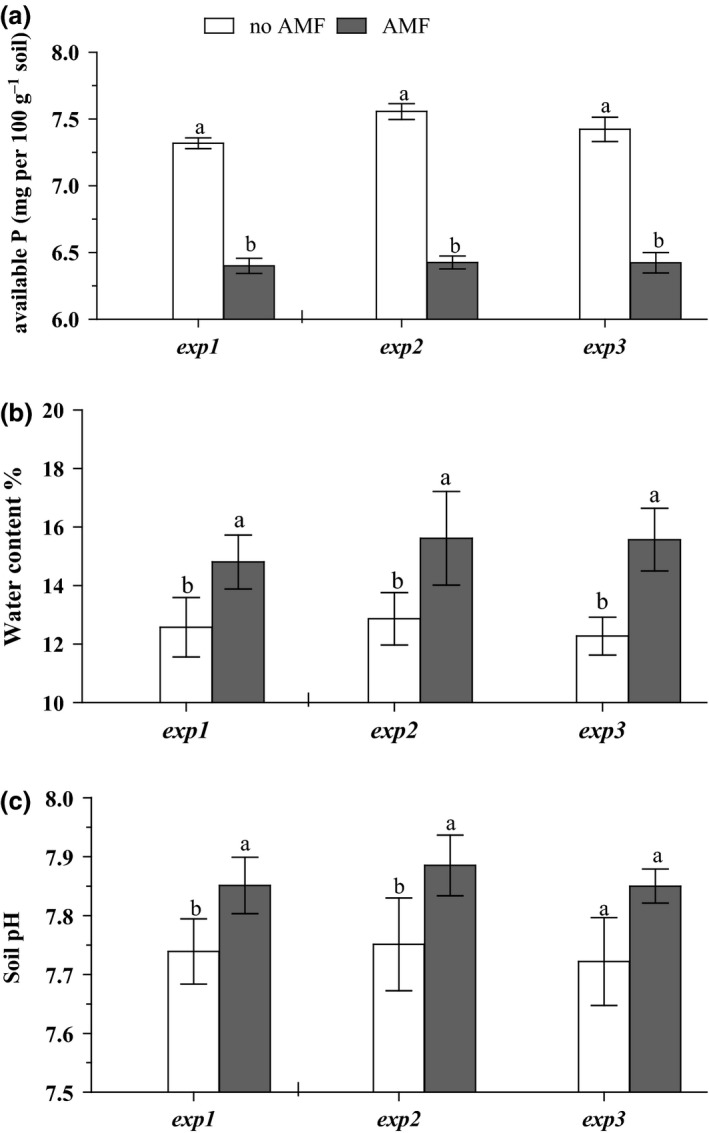
Figure 3.

Effects of rotated RECs (no AMF) and static RECs (with AMF access) on (a) phosphorus concentration of soil, (b) water content, and (c) soil pH for all experiments. Means and standard deviation (n = 10) are shown. Different letters indicate significant differences between the treatments at p < .05 according to the Tukey–Kramer HSD test
