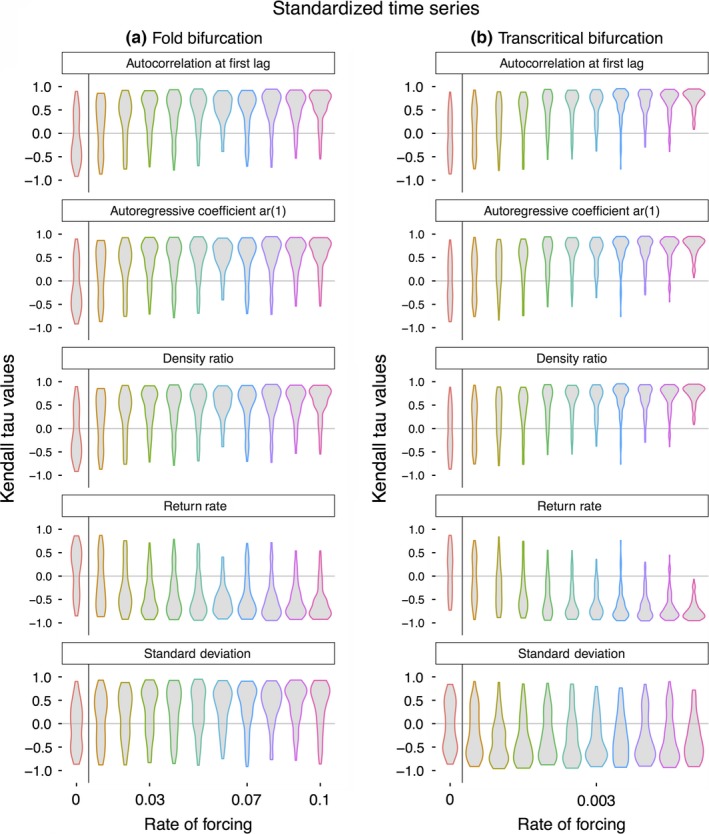
Figure 2.

Strength of the trend in five leading indicators of population collapse when time‐series lengths were standardized (see section 2) across (a) simulated population collapses exhibiting a fold bifurcation, and (b) simulated population collapses exhibiting a transcritical bifurcation. Violin plots indicate the distribution of Kendall tau values for each rate of forcing
