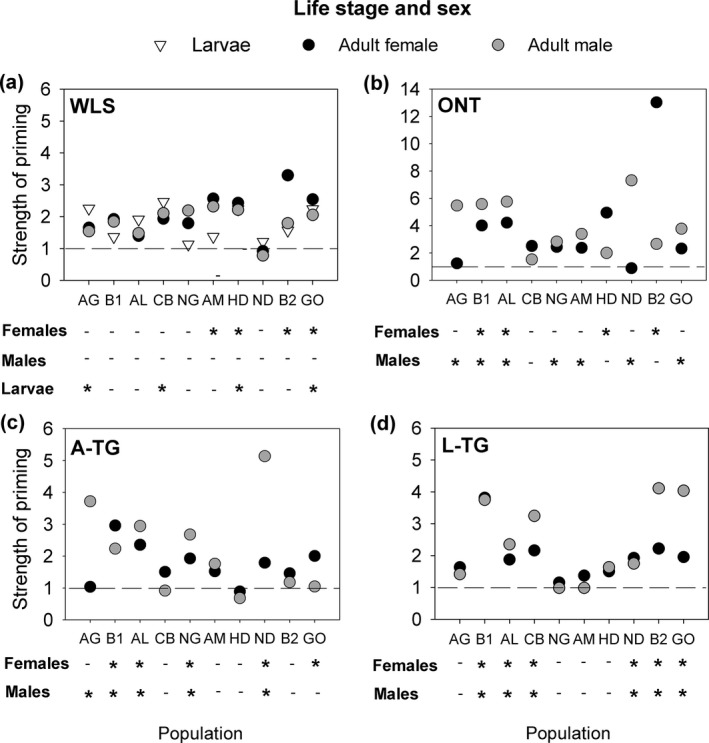
Figure 3.

Variation in priming response across sexes, life stages, and populations. (a) Within‐life stage immune priming (WLS) benefit in larvae and adults, (b) ontogenic (ONT) immune priming benefit, (c) transgenerational benefits of priming adult females (A‐TG), (d) transgenerational benefits of priming females at larval stage (L‐TG). Strength of immune priming response was calculated as the hazard ratio of the proportion of deaths occurring in the unprimed group compared with the primed group under a proportional hazard model. Horizontal dashed lines in each panel indicate a hazard ratio of 1. “*”and “‐” denote significant (p ≤ .05) and nonsignificant (p > .05) impact of immune priming in each stage, sex, and population. Sample sizes for each group are given in Figure 2
