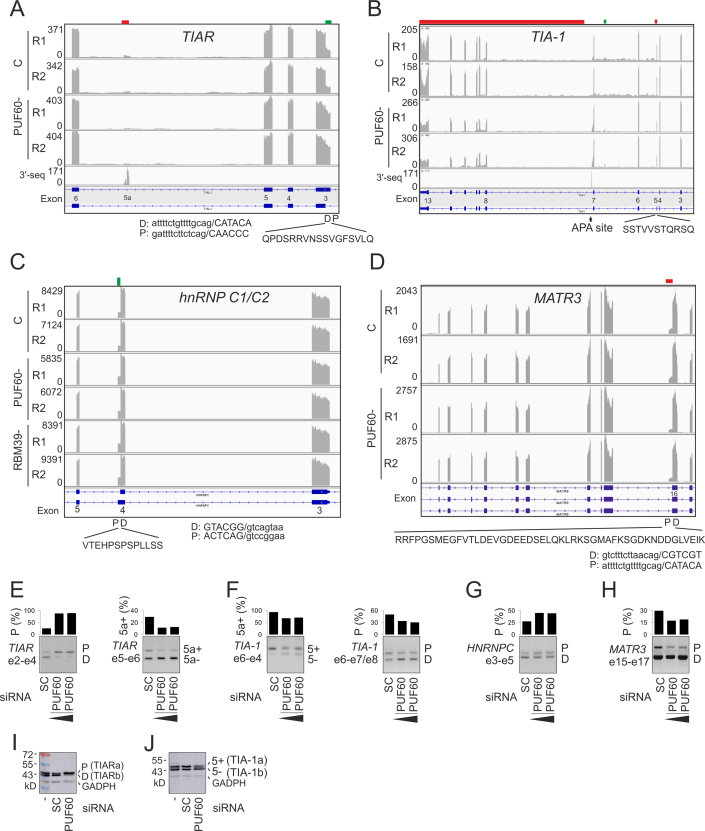
Figure 3.
Alternative splicing of U-binding interaction partners of PUF60 in depleted cells. (A–D) Genome browser views of RNA-Seq tracks in control (C) and depleted (–) cells. Down- and up-regulated exonic segments are marked by red and green rectangles at the top, respectively. Y-axis, sequencing read numbers. R1, R2; replicates. Peptides encoded by PUF60/RBM39-dependent exons are shown at the bottom together with their intron-proximal (P) or -distal (D) 3′ss. The 3′-seq tracts superimpose the APA atlas data (43). (A) TIAR. (B) TIA-1. (C) HNRNPC. (D) MATR3/SNHG4. (E–H) RT-PCR validation from independent transfections. The final siRNA concentrations were 50 and 90 nM. SC, scrambled controls. Exons (e) containing amplification primers (Supplementary Table S1) are to the left and RNA products are to the right in each panel. Columns show the relative abundance of the indicated transcripts (shown in panels A–D). (I, J) Immunoblotting of PUF60- and control cells with anti-TIAR (I) and anti-TIA-1 (J) antibodies. The extra band between TIA-1a and TIA-1b is likely to result from phosphorylated residue(s) reported in the peptide shown in panel B (http://www.phosphosite.org).

