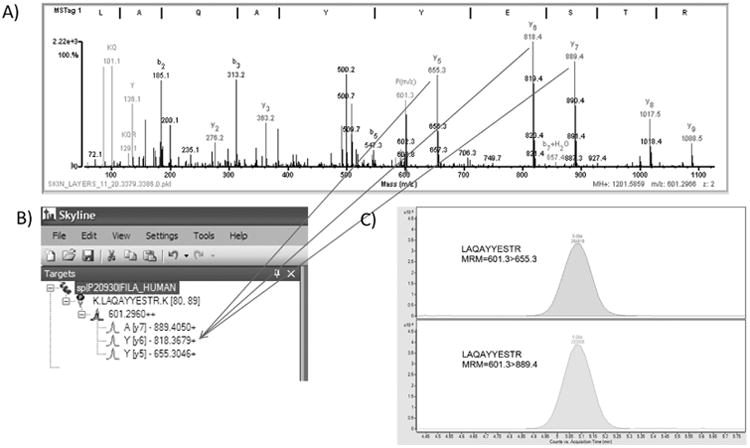
Figure. 1.

QTOF data was used to determine peptides and transitions. 1A: Product MS/MS spectrum for peptide LAQAYYESTR with precursor m/a 601.2966. Data was generated on a QTOF mass spectrometer as described in the methods. Data was searched against a SpectrumMill database as previously described 2,3. 1B: Skyline was used to generate predicted peptides from a theoretical trypsin digest and the predicted y and b peptide ion fragments. Arrows indicate the experimentally determined fragments in the Q-TOF data. 1C: An extracted ion chromatogram is shown for two transitions, 601.3 > 655.3 and 601.3 > 889.4, generated for peptide LAQAYYESTR. Data was generated on the QQQ mass spectrometer.
