
Figure. 3.
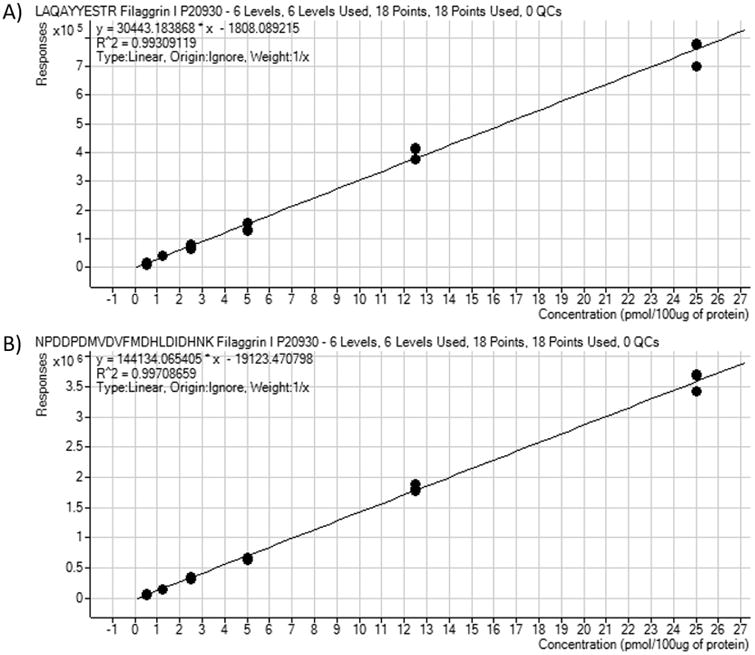
Calibration curves for labeled peptides of one representative protein, Filaggrin I. Pooled protein samples were spiked with 6 concentrations of labeled peptides prior to digestion. Samples were analyzed on the QQQ mass spectrometer as described. Curves were generated as described in the methods. Calibration curve for peptide LAQAYYESTR is shown in 3A. Calibration curve for peptide NPDDPDMVDVFMDHLDIDHNK is shown in 3B.