
Figure 6. HDAC1 deacetylates p150Glued at lysine 230.
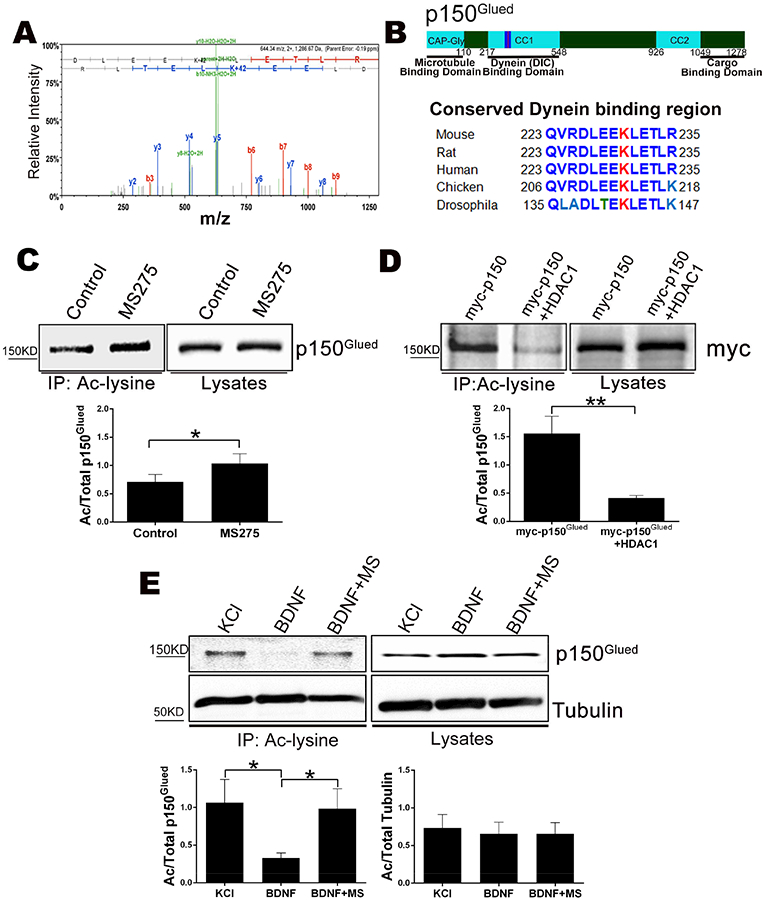
A. MS/MS spectrum of acetylated p150Glued tryptic peptide spanning lysine 230. Annotated product ions highlighted in red and blue correspond to b- and y- type ions, respectively. Neutral loss ions from the peptide precursor or product ions are highlighted in green. The observed product ions confirmed acetylation at K230 as indicated by a 42 Da mass shift.
B. (Top) Schematic of p150Glued. (Bottom) Comparison of protein sequences from the DIC binding region of CC1 around K230 from the indicated species.
C. Inhibition of HDAC1 increases the acetylation of p150Glued. (Top) HEK293 cells were treated +/− MS275 for 48 hrs, fractionated and cytosolic lysates were immunoprecipitated with anti-acetyl lysine and western blotted for p150Glued. (Bottom) Bar graph showing the average ratio of acetylated over total p150Glued ± SEM for n=7; *, p < 0.05, student’s t-test.
D. Over expression of HDAC1 reduces the amount of acetylated p150Glued. (Top) HEK293 cells were transfected with Myc-p150Glued with or without HDAC1-Flag. The cytosolic lysates were immunoprecipitated with anti-acetyl lysine and western blotted with an antibody to Myc. (Bottom) The average ratio of acetylated over total p150Glued ± SEM for n=5; **, p < 0.01, student’s t-test.
E. Activation of p75NTR reduces the level of acetylated p150Glued. Sympathetic neurons were treated with 12.5 mM KCl or 200 ng/ml BDNF +/− 5 μm MS275 (MS) for 48 hrs. The neurons were fractionated and the cytosolic lysates were immunoprecipitated with anti-acetyl lysine and western blotted for p150Glued or alpha-Tubulin. (Top) Representative western blot image. (Bottom) The average ratio of acetylated over total p150Glued or tubulin ± SEM for n=6–7; *, p < 0.05, student’s t-test.