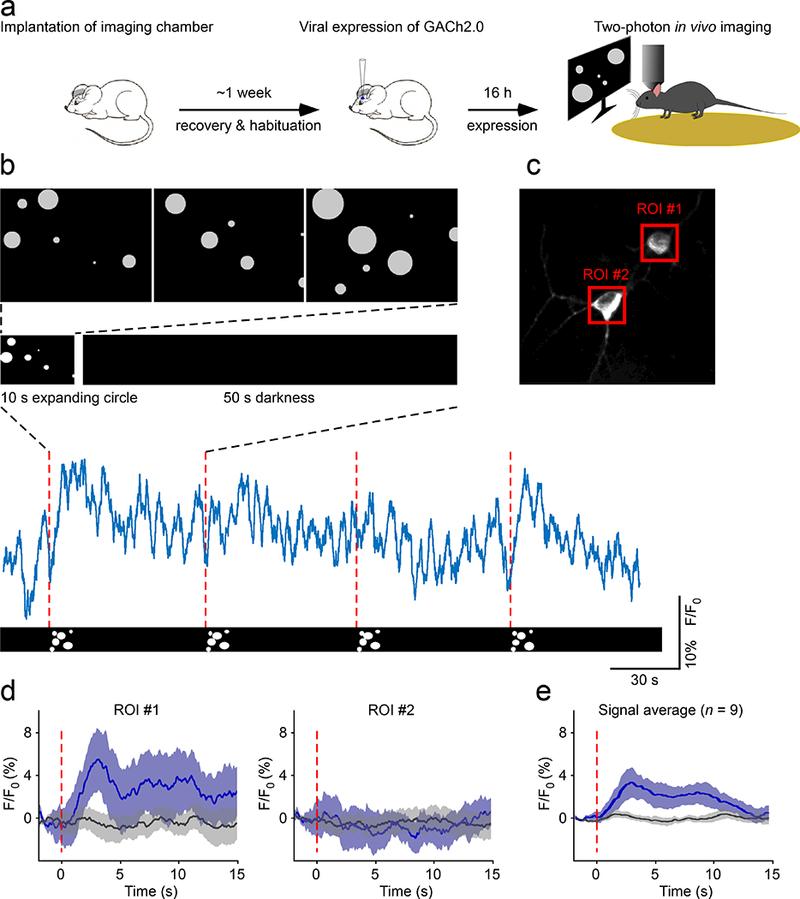
Figure 6. Attention-engaging visual stimuli evoke ACh release in behaving mice.

(a) Schematic drawing outlines the design of in vivo imaging experiments.
(b) Upper, schematic representation of the visual stimulus applied to head-fixed behaving mice. The visual stimulus consists of 10 seconds of expanding white circles appearing at random locations on the screen, followed by 50 seconds of darkness. Lower, 4-minute fluorescence response traces corresponding to the four repetitions of single stimuli.
(c) An imaged region (100 × 100 μm, 120 μm deep) contains two GACh2.0 expressing neurons with the red squares indicating regions of interest (ROIs).
(d) Mean fluorescence responses from ROIs shown in (b). The fluorescence response traces were divided into 10 second segments with every minute containing one 10-s trace corresponding to the period of visual stimulus and five 10-s traces corresponding to periods of darkness. The signal from the middle three dark segments (black line) was compared to the signal from the visual stimulus segments (blue line; 15 trials per region). Shaded bands around the solid blue trace show the 95% confidence interval obtained by bootstrap. Note that ROI #1, but not ROI #2, shows an increase in fluorescence responses to the visual stimulus.
(e) Average fluorescence responses obtained during the period of visual stimulation compared to those during the period of darkness (Visual: 3.37 ± 2.26%; Dark: 0.05 ± 0.83%; Z = −2.666, p = 0.008; n = 9 neurons from 8 animals). Note the same ACh signals observed after 1-day (n = 5 neurons from 4 animals), 2-day (n = 2 neurons from 2 animals), and 4−6-day (n = 2 neurons from 2 animals) in vivo Sindbis or rapid AAV viral expression, which suggest the suitability of GACh sensors for multiple-day imaging, and the analysis made from the pooled data.
Data are shown with mean ± s.e.m, with shaded bands indicate s.e.m. Wilcoxon tests performed in (e), two-sides.
