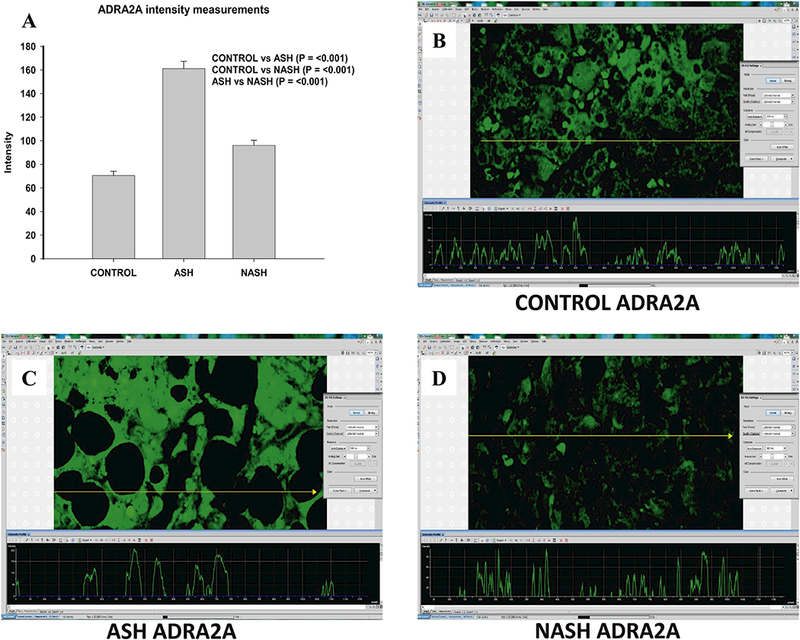
Figure 3.

Different Changes of ADRA2A in ASH and NASH specimens. (A) Level of expression of ADRA2A protein upregulated in ASH, NASH or normal controls. Expression is measured as fluorescence intensity and displayed as mean +/− standard deviation. Representative images of fluorescence intensity to measure ADRA2A expression in normal control (B), ASH (C) and NASH (D) liver specimens.
