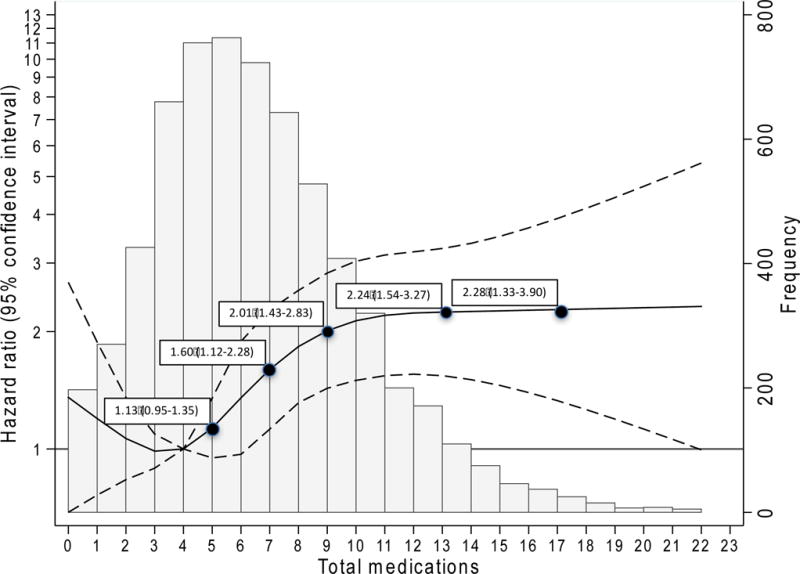
Figure 3. Risk of death across total number of medications.

Key: Histogram depicts the distribution of total number of medications in the cohort (right y-axis). The solid black line (black dashed lines are 95% confidence interval) is the adjusted hazard ratio, representing the average (covariates were centered at cohort means) participant’s risk of death across total number of medications, relative to the reference (4 medications). Model was adjusted for estimated glomerular filtration rate, hypertension, cardiovascular disease, diabetes, heart failure, self-reported myocardial infarction, Charlson Comorbidity Index, frailty, sex, race, age, Body Mass Index, current smoking status, current alcohol use, Mini-Mental State Evaluation, high-density lipoproteins, low-density lipoproteins, triglycerides, and total vitamins/supplements.
