Figure 6.

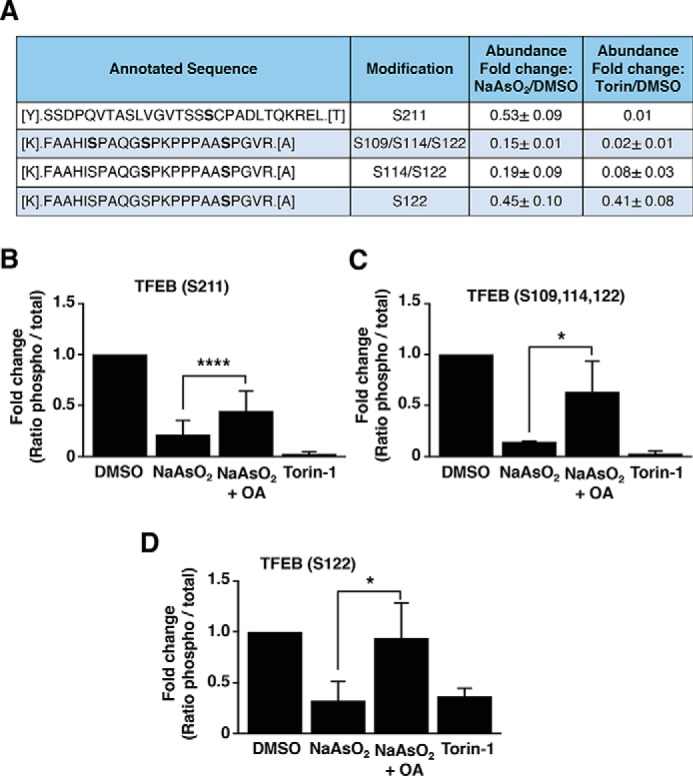
Protein phosphatase 2A dephosphorylates TFEB at different residues. A, mass spectrometry analysis of the phosphorylation status of TFEB-FLAG from U-2 OS cells treated with either vehicle, 150 μm NaAsO2 or 250 nm Torin-1 for 2 h. The relative abundances of the indicated phosphopeptides were compared based on the areas under curve of their corresponding chromatographic peaks and are shown as fold-change from its corresponding vehicle-treated cells. Data are presented as mean ± S.D. from two independent experiments. B–D, mass spectrometry analysis of the phosphorylation status of TFEB-FLAG in Ser-211 (B), Ser-109, -114, and -122 (C), and Ser-122 (D) from HeLa (CF7) cells treated with either vehicle or 300 μm NaAsO2 in the presence or absence of 400 nm okadaic acid or 250 nm Torin-1 for 1.5 h. The relative abundances of the indicated phosphopeptides were compared based on the areas under curve of their corresponding chromatographic peaks and are shown as fold-change from its corresponding vehicle-treated cells. Data are presented as mean ± S.D. using one-way ANOVA, (*) p < 0.05 and (****) p < 0.0001, from three independent experiments.
