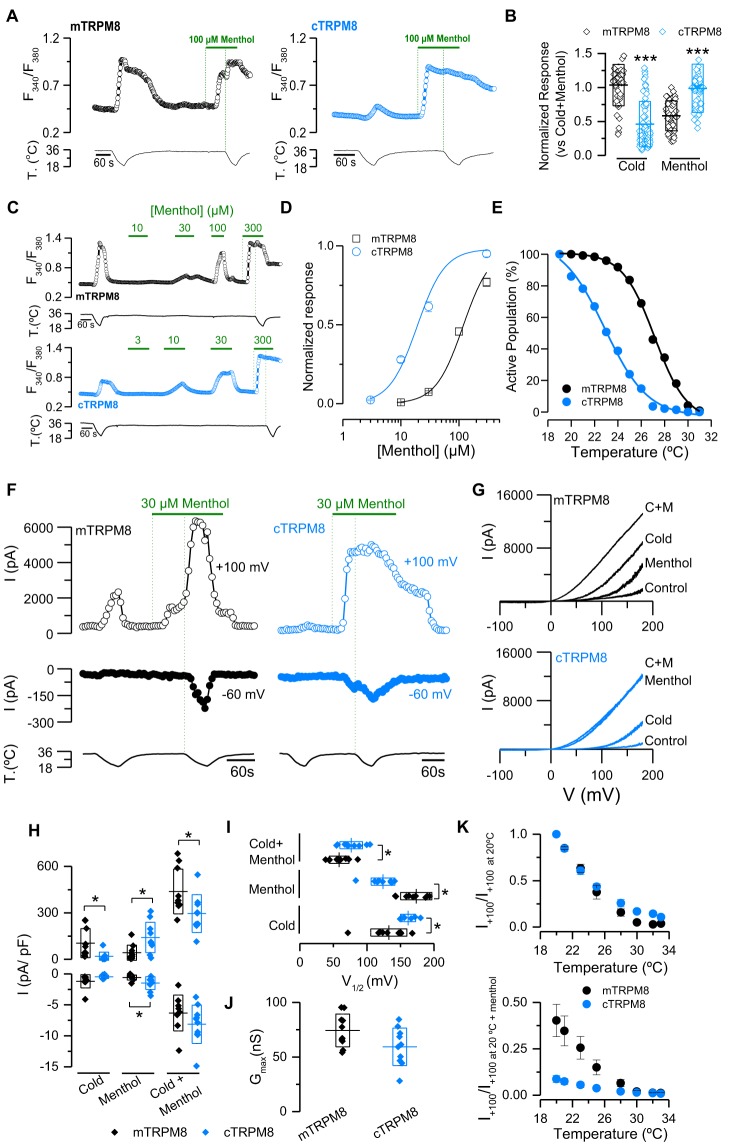
Figure 1.
Differential responses to cold and menthol in cTRPM8 compared with mTRPM8. A, representative ratiometric [Ca2+]i traces showing responses of HEK293 cells transfected with mTRPM8 (black) and cTRPM8 (blue) to cold, 100 μm menthol, and a combined stimulus of cold in the presence of 100 μm menthol. Upper trace shows [Ca2+]i and lower trace represents bath temperature. In this study, green vertical dotted lines indicate the start of menthol and cold + menthol stimuli. B, scatter plot with mean ± S.D. Individual values were normalized to the maximal response of the cells in the cold plus menthol condition. Statistical significance was assessed with an unpaired Student's t test: ***, p < 0.001; mTRPM8, n = 45; cTRPM8, n = 91. C, time course of [Ca2+]i in HEK293 cells transfected with mTRPM8 and cTRPM8. D, menthol concentration-response curves at 34 °C in transfected HEK293 cells (mTRPM8, n = 77; cTRPM8, n = 51). Responses were normalized to the amplitude obtained with maximal stimulation (300 μm menthol plus cold). E, percentage of the active population, defined as the fraction of cells that are positively transfected and whose apparent temperature threshold exceeds the temperature at that point, recruited during a cooling ramp in HEK293 cells transfected with mTRPM8 (n = 122) or cTRPM8 (n = 142). F, representative recording of whole-cell currents measured at +100 and −60 mV in HEK293 cells transfected with mTRPM8 or cTRPM8 channels. G, current–voltage relationships of mTRPM8 and cTRPM8 at 34 °C in control solution (Control), at 20 °C in control solution (Cold), menthol at 34 °C (Menthol), and menthol at 20 °C (Cold + Menthol). H–J, scatter plot with mean ± S.D. of all values corresponding to the maximal current density at +100 and −60 mV (H), V1/2 values (I), and gmax estimated in the cold + menthol condition (J). K, relative currents of mouse and chicken TRPM8 at +100 mV during a cold pulse. In the upper panel, the values are normalized to I+100 mV at 20 °C; in the bottom panel, they are normalized to I+100 mV at 20 °C during menthol application. Recordings from mouse and chicken TRPM8 were always interlaced on the same day. Statistical significance was assessed with a two-tailed unpaired Student's t test: *, p < 0.05; ***, p < 0.001; n > 5 cells for each condition.

