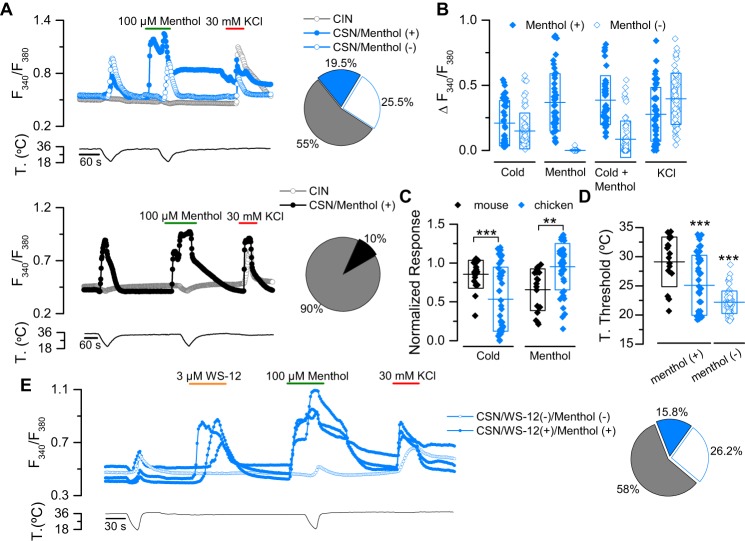
Figure 2.
Native cTRPM8 displays both smaller cold-induced responses and higher menthol-induced responses than mTRPM8. A, ratiometric [Ca2+]i response of representative cold-sensitive/menthol-sensitive neurons (CSN/Menthol (+)), cold-sensitive/menthol-insensitive neurons (CSN/Menthol (−)), and cold-insensitive neurons (CIN) from chicken (upper panel) and mouse (bottom panel) DRG neurons. The protocol used consisted of a cooling ramp, followed by application of 100 μm menthol at 34 °C, followed by a cold ramp in the presence of the chemical activator, and finally depolarization induced by 30 mm KCl. The pie plots on the right summarize the percentages of each subpopulation. B, scatter plot with mean ± S.D. of the responses to cold, menthol, cold+menthol, and KCl of Menthol (+) and Menthol (−) CSNs from chicken DRG neurons (cCSNs/Menthol (+) n = 45, and cCSNs/Menthol (−) n = 59). C, scatter plot with mean ± S.D. of cold- and menthol-induced responses normalized to the maximal response (cold plus menthol) of chicken and mouse CSN/Menthol (+) neurons. Statistical significance was assessed with an unpaired Student's t test. **, p < 0.01; ***, p < 0.001; mCSN/Menthol (+) n = 19, cCSN/Menthol(+) n = 45. D, mean temperature threshold of cold-sensitive neurons from chicken and mouse DRGs (mCSN/Menthol (+), n = 19 (black), cCSN/Menthol (+), n = 45 (blue), and cCSN/Menthol (−), n = 59 (white)). Statistical significance was assessed by an ANOVA in combination with a Bonferroni's post hoc test: ***, p < 0.001. E, ratiometric [Ca2+]i response of representative cold-sensitive/WS-12-sensitive/menthol-sensitive (CSN/WS-12 (+)/Menthol (+)) and cold-sensitive/WS-12-insensitive/menthol-insensitive (CSN/WS-12 (−)/Menthol(−)) neurons from chicken DRG neurons. The pie plot on the right summarizes the percentages of each subpopulation (cCIN, n = 83 (gray); cCSN/WS-12 (+)/Menthol (+), n = 23 (blue) and cCSN/WS-12(−)/Menthol (−), n = 38 (white)).

