Figure 3.
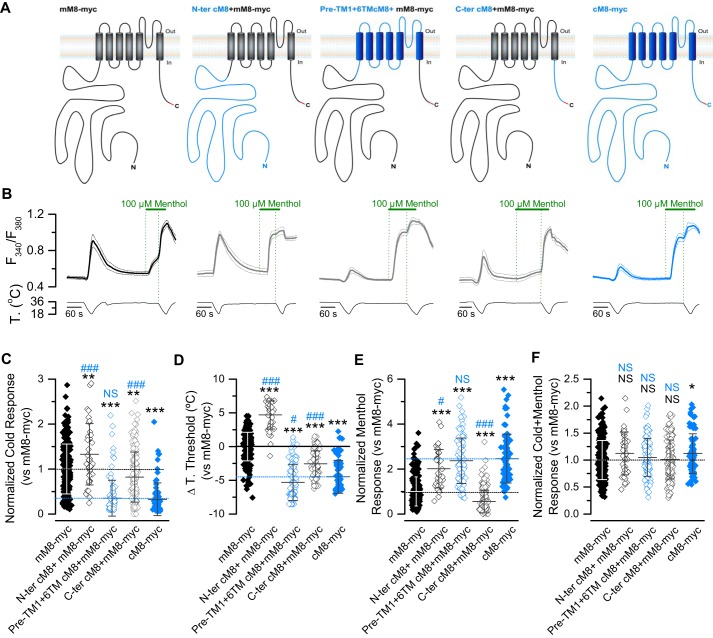
The functional behavior of the cTRPM8 channel is not related with the residues in its cytosolic domains. A, schematic representation of chimeric channels. The sequences from cTRPM8 are colored in blue, and the sequences from mTRPM8 in black. The presence of the Myc epitope in the C-terminal domain is highlighted in red. B, average (solid line) ± S.E. (dotted lines) time course of [Ca2+]i level (F340/F380) in HEK293 cells (n > 15 cells in each case) transfected with mM8-myc (black), chimeric channels (gray), and cM8-myc (blue). C–F, Scatter plot with mean ± S.D. of cold- (C), menthol- (E), and cold + menthol–induced responses (F) of TRPM8 orthologs and chimeras. The values were normalized to the mean response observed in mM8-myc (control condition) in parallel experiments. (mM8-myc, n = 253; N-ter cM8+mM8-myc, n = 38; pre-TM1+6TMcM8+mM8-myc, n = 105; C-ter cM8+mM8-myc, n = 165; cM8-myc, n = 78.) Mean shift in temperature threshold displayed by each mutant is expressed according to the mM8-myc values. Positive values indicate shifts toward warmer temperatures (D). In A–C, statistical significance was assessed by an ANOVA test in combination with a Dunnett's post hoc test: *, p < 0.05; **, p < 0.01; ***, p < 0.001, compared with mM8-myc; #, p < 0.05; ###, p < 0.001 to cM8-myc; NS, not significant.

