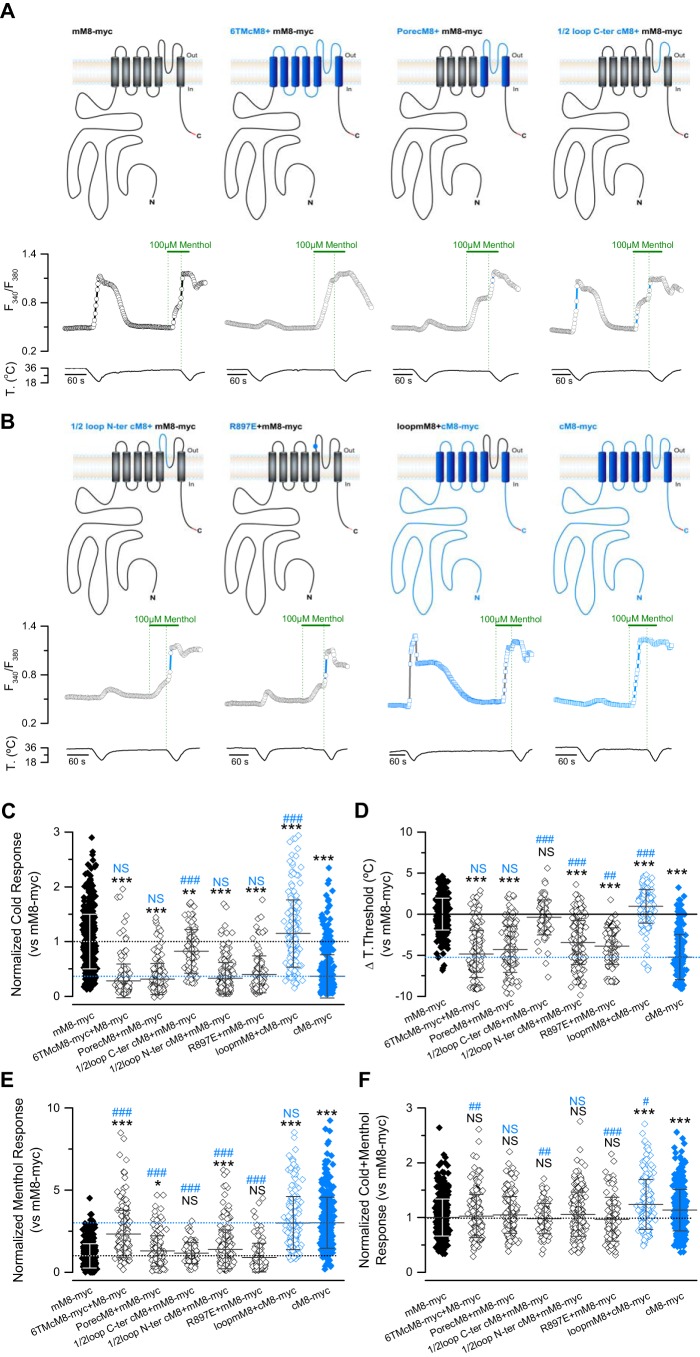
Figure 4.
The small cold-induced response of cTRPM8 compared with mTRPM8 is because of residues in the pore loop. A and B, upper panels, schematic representation of the chimeric channels. Sequences from cTRPM8 are colored in blue, and sequences from mTRPM8 in black. The Myc epitope in the C-terminal domain of the channels is highlighted in red. A representative intracellular Ca2+ trace (F340/F380) of each construct is shown below each channel. C–F, mean responses to cold (C), menthol (E), and cold plus menthol (F) of TRPM8 orthologs, chimeras, and mutants characterized in this part of the study. The values were normalized to the mean response observed in mM8-myc (control condition) in parallel experiments; mM8-myc, n = 524; 6TMcM8+mM8-myc, n = 187; porecM8+mM8-myc, n = 176; ½loop N-ter cM8+mM8-myc, n = 207; ½loop C-ter cM8+mM8-myc, n = 86; R897E+mM8-myc, n = 110; loopmM8+cM8-myc, n = 198; cM8-myc, n = 391. In D, scatter plot with mean ± S.D. shows the temperature threshold shift displayed by each mutant expressed according to the mM8-myc values. Positive values indicate shifts to warmer temperatures. Statistical significance was assessed by an ANOVA test with a Dunnett's post hoc test: *, p < 0.05; **, p < 0.01; ***, p < 0.001 to mM8-myc; #, p < 0.05; ##, p < 0.01; ###, p < 0.001 to cM8-myc; NS, not significant.

