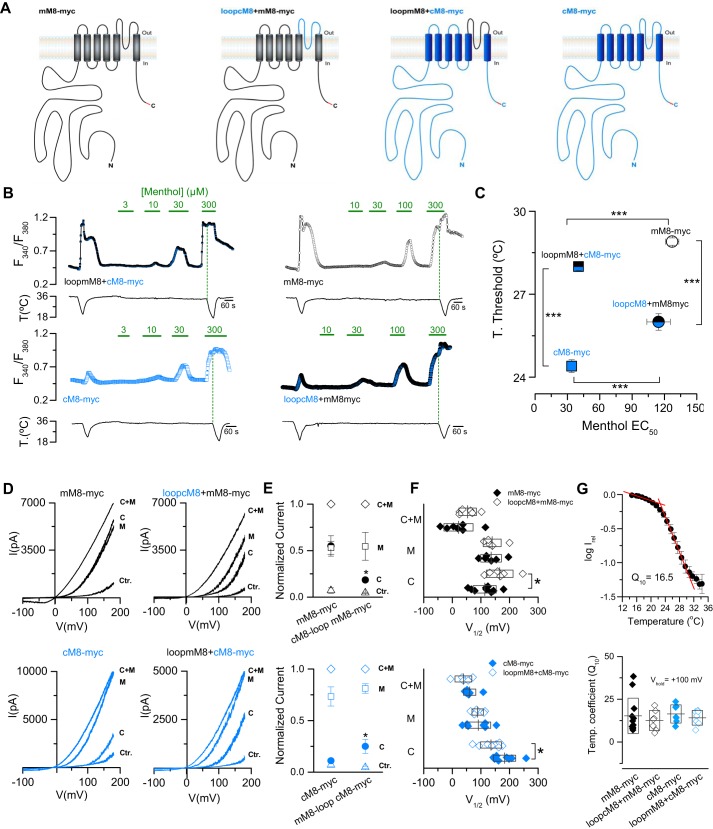
Figure 5.
The pore loop of TRPM8 as a key molecular determinant of the distinctive cold-induced response of chicken and mouse orthologs. A, schematic representation of the constructs. B, time course of the [Ca2+]i response in HEK293 cells transfected with these constructs. C, relationship of mean temperature activation thresholds and the EC50 to menthol for each construct (mM8-myc, n = 123; cM8-myc, n = 144; cM8loop+mM8-myc, n = 72; mM8loop+cM8-myc, n = 139). Statistical significance was assessed by an ANOVA in combination with a Bonferroni's post hoc test. ***, p < 0.001. In the case of the data displayed by the blue and black square, the size of the dot representing the mean value is bigger than S.E. D, current–voltage relationships obtained in HEK293 cells transfected with these four constructs at 34 °C in control solution (Ctr.), at 20 °C in control solution (C), at 34 °C with 100 μm menthol (M), and at 20 °C during a stimulus of 100 μm menthol (C + M). E, normalized values (to cold + menthol condition) of the currents obtained at +100 mV in the different conditions tested. F, scatter plot with mean ± S.D. of V1/2 values. In E and F, experiments were performed in pairs: mM8-myc versus cM8loop-mM8-myc and cM8-myc versus mM8loop+cM8-myc. Statistical significance was assessed with a two-tailed unpaired Student's t test: *, p < 0.05; n ≥ 5 cells for each condition. G, the upper panel shows the plot of log (I) versus temperature of cells transfected with mM8-myc; each point represents the average of 10 experiments. Cold-induced currents were measured at the end of 75 ms voltage steps from 0 to +100 mV (0.5 Hz) during a cold ramp from 35 to 15 °C. The bottom panel summarizes the Q10 values for each construct; n = 7–10 cells for each condition.

