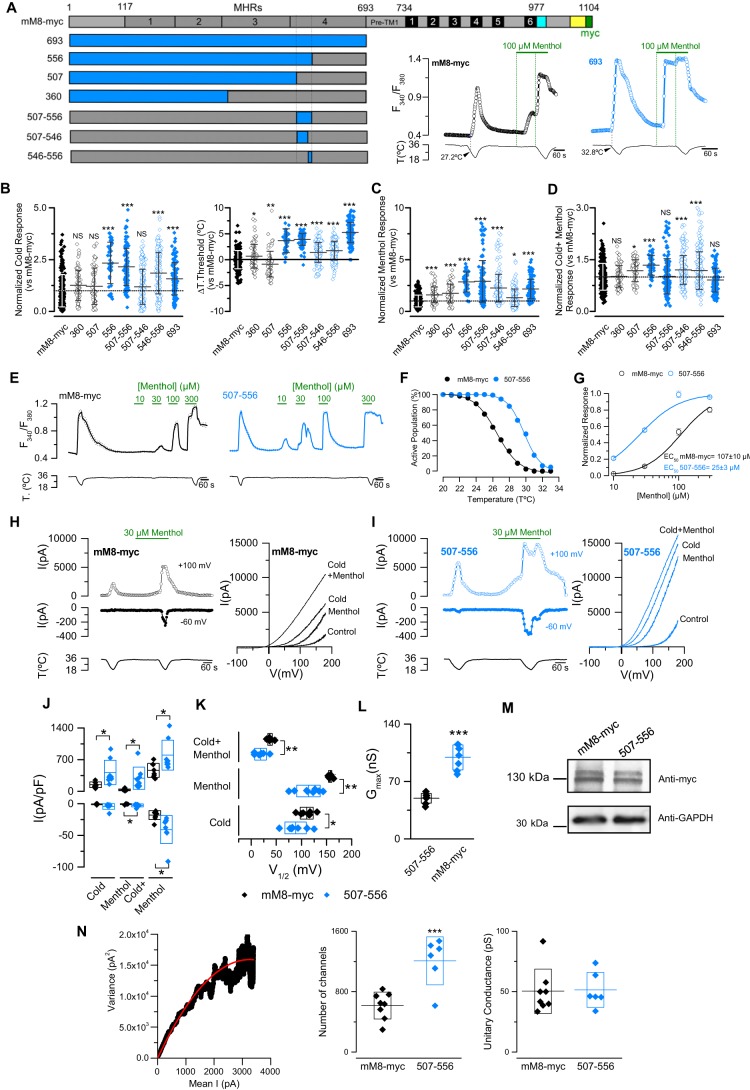
Figure 6.
Transference of the proximal N-terminal domain of cTRPM8 to the murine ortholog produces an increase in its responses to cold and menthol. A, upper horizontal bar, primary structure of TRPM8. The TRP domain (in cyan), the coiled-coil region (in yellow), and the Myc epitope (in green) are depicted. Lower horizontal bars, schematic representation of N-terminal chimeras; sequences from cTRPM8 are colored in blue, and sequences from mTRPM8 in gray. On the right, representative time course of [Ca2+]i in HEK293 cells transfected with mM8-myc (black) and 693 chimeric channels (blue) are shown. B–D, scatter plots with mean ± S.D. of the individual responses to cold (B), menthol (C), and cold + menthol (D) of TRPM8 N-terminal chimeras. The values were normalized to the mM8-myc mean response. (mM8-myc, n = 239; 360, n = 79; 507, n = 63; 556, n = 45; 693, n = 125; 507–556, n = 114; 507–546, n = 195; 546–556, n = 195). Right panel in B shows the shift in temperature threshold displayed by each mutant expressed according to the mM8-myc values. Statistical significance in B–D was assessed by an ANOVA test in combination with a Dunnett's post hoc test; *, p < 0.05; ***, p < 0.001, compared with mM8-myc. E, time course of [Ca2+]i response in transfected HEK293 cells. F, percentage of active population recruited during a cooling ramp in positively transfected HEK293 cells (mM8-myc, n = 157; 507–556, n = 256). G, menthol concentration-response curves. The Hill equation fit yielded an EC50 of 107 ± 10 μm for mM8-myc (n = 47) and 25 ± 3 μm for 507–556 (n = 50). Responses were normalized to the amplitude obtained with maximal stimulation (300 μm menthol plus cold). H and I, left panels, representative whole-cell currents measured at +100 and −60 mV in HEK293 cells transfected with mM8-myc (H) and 507–556 (I). Right panels show current–voltage relationships for each condition: control, cold, 30 μm menthol, and cold + menthol. J–L, scatter plots with mean ± S.D. of the values of maximal current density at −60 and +100 mV (J), V1/2 (K) and gmax values estimated in cold + menthol condition (L). Statistical significance was assessed with a two-tailed unpaired Student's t test: *, p < 0.05; n > 6 cells for each condition. M, Western blots of lysates from HEK293 cells transfected with mM8-myc and 507–556, probed with an anti-Myc antibody and anti-GAPDH as a loading control. N, left panel, dot plot of variance versus mean current obtained from whole-cell current of an HEK293 cell expressing mM8-myc channels. Solid line corresponds to the fit of the data to a parabola (Equation 3). Right panels, scatter plots with the mean ± S.D. of the number of active channels and unitary conductance, for both mM8-myc and 507–556. Statistical significance was assessed with a two-tailed unpaired Student's t test: ***, p < 0.001; n ≥ 6 cells for each condition.

