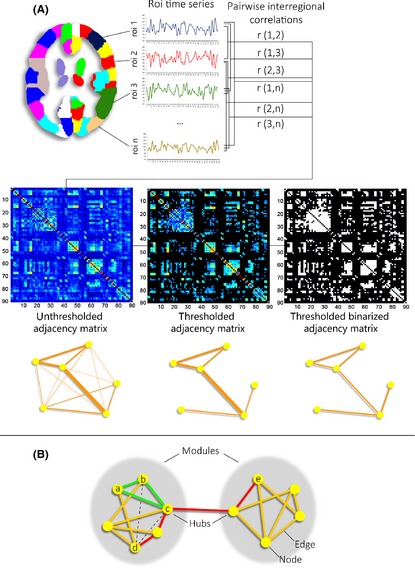
Figure 3.

Panel A: Definition of functional brain networks. In its simplest form, the functional connectivity between a given pair of nodes is defined by the Pearson correlation between their respective time series. An adjacency matrix representing all internodal correlation coefficients is subsequently thresholded to discard weak, possibly noise‐related connections. There is no universally accepted approach for thresholding, however. The use of fixed strength thresholds can result in graphs with different connection density, making intersubject comparisons difficult 94. Fixed density thresholds, on the other hand, can be inappropriate in the presence of significant overall connectivity differences 94. The resulting graphs will be weighted if correlation strength is taken into account. Otherwise, binary graphs are generated. Panel B: Global and nodal network metrics. In the small network shown, the red line indicates the shortest path between nodes d and e. The characteristic path length of a node informs about how closely connected this node is to all other network nodes. It is given by the average shortest path length between itself and every other node, or, in its binary form, the average number of edges that need to be traversed in order to get from this to any other node 95. Network integration is given by the global characteristic path length (average of the characteristic path lengths of all nodes). The clustering coefficient of node a is represented by the number of triangles formed with its neighboring nodes (b, c, and d) 111. Only one triangle (green, a‐b‐c) is present out of three possible triangles (dashed lines, a‐b‐d and a‐c‐d), yielding a clustering coefficient of 1/3. The clustering coefficient describes how interconnected a node's neighbors are. The global clustering coefficient, given by the average of the clustering coefficients of all nodes in a network, is a measure of local connectedness or network segregation. A balance between global characteristic path length and clustering coefficients defines small‐world networks, characterized by high local specialization and some global shortcuts, allowing fast information transfer 111, 112. The human connectome displays small‐world topology in both functional and structural networks 112, 113. The degree of a node (number of input or output connections linked to it) describes this node's accessibility within the network 114. Degree in neural networks follows a heavy‐tailed distribution, indicating the existence of a set of highly connected or hub nodes 115. Hubs are hypothesized to be relevant for overall information transfer 116 and appear to be preferentially affected in several disorders 117. Finally, the measure of modularity indicates how well a network can be subdivided into well‐defined modules or communities made up of densely interconnected nodes with few intermodular connections, possibly representing the network's functional subcomponents. The small network shown contains two modules, connected by two connector hub nodes.
