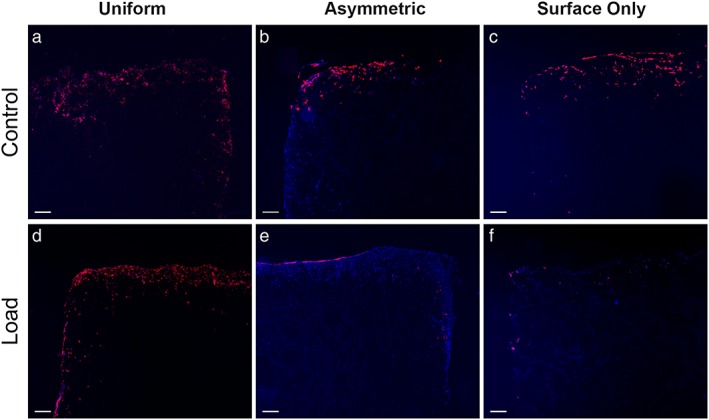
Figure 2.

Fluorescent images showing the location of labelled cells after 4 weeks of load. Images (a), (b) and (c) show control scaffolds from Uniform, Asymmetric and Surface Only seeded scaffolds respectively, while images (d), (e) and (f) show loaded scaffolds. Red fluorescence shows the membranes of labelled cells, blue shows nuclei counterstained with 4′,6‐diamidino‐2‐phenylindole (DAPI) (n = 1). Bar, 200 μm. [Colour figure can be viewed at http://wileyonlinelibrary.com]
