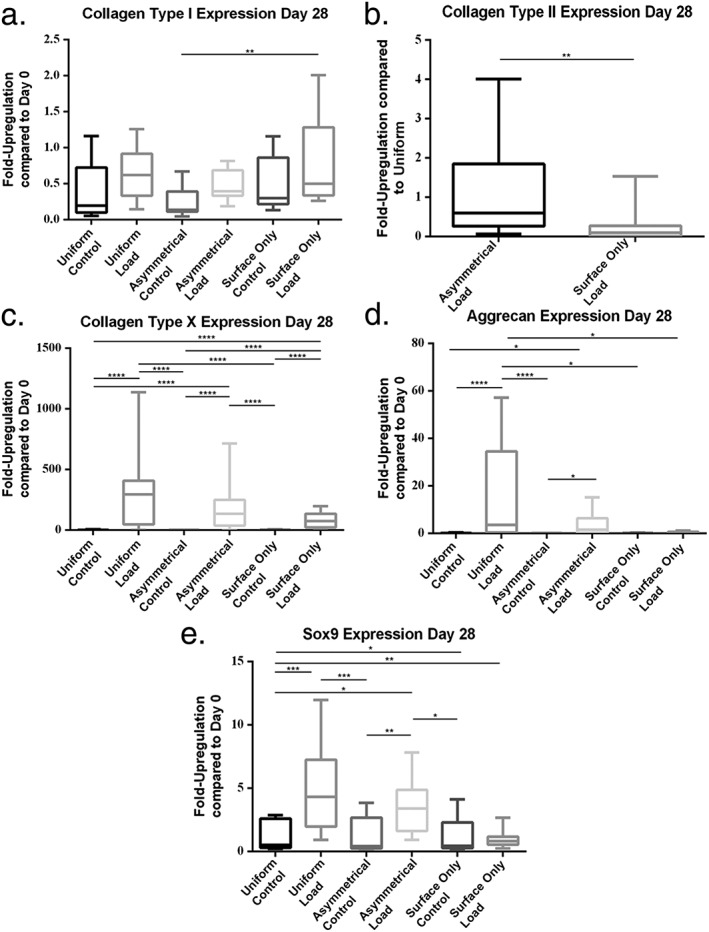
Figure 5.

Gene expression measured at day 28 of culture by real‐time polymerase chain reaction (PCR). (a) Collagen type I, (b) collagen type II, (c) collagen type X, (d) aggrecan and (e) Sox9. Error bars represent standard deviation. Statistical significance was defined as P ≤ 0.05; *P ≤ 0.05, **P ≤ P≤0.001 and ***P ≤ 0.0001
