Figure 4.

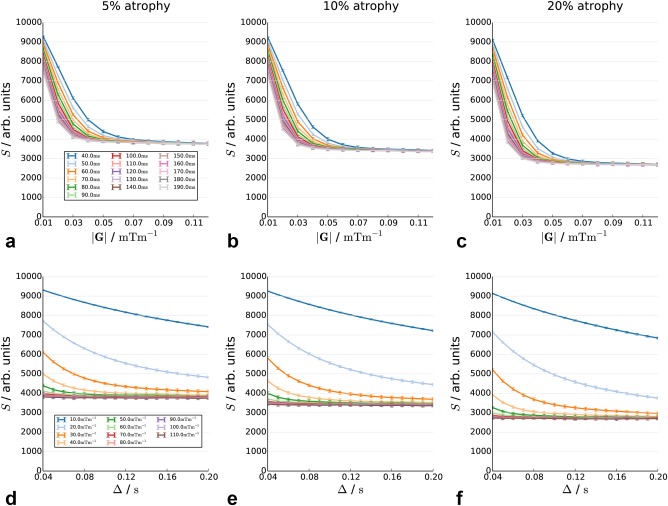
Decay curves in substrates with 5, 10, and 20% atrophy in the internal cylinder radius, as a function of diffusion time (top row) and gradient strength (bottom row).

Decay curves in substrates with 5, 10, and 20% atrophy in the internal cylinder radius, as a function of diffusion time (top row) and gradient strength (bottom row).