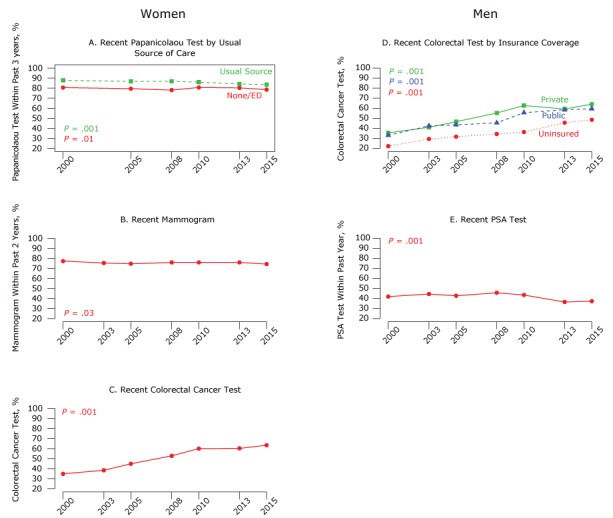
Figure 2.
Trends in use of cancer screening tests among women and men, National Health Interview Survey, 2000–2015 (www.cdc.gov/nchs/nhis/index.htm). A. Prevalence of having a Papanicolaou test within past 3 years among women aged 20 to 65. B. Prevalence of having a mammogram among women aged 50 to 74 within past 2 years. C. Prevalence of having a recent colorectal cancer test among women aged 50 to 75 (for colorectal cancer tests, recent is defined as having a fecal occult blood test [FOBT] in the past year, flexible sigmoidoscopy in past 5 years with FOBT in past 3 years, or colonoscopy in past 10 years). D. Prevalence of having a recent colorectal cancer test, by insurance coverage, among men aged 50 to 75. E. Prevalence of having a PSA test among men aged 50 and older. Estimates were adjusted for age, education, poverty, usual source of care, type of health insurance, race/ethnicity, length of US residency, physician visit in the past year, and among women, OB/GYN visit in the past year. Abbreviations: ED, emergency department; PSA, prostate-specific antigen.
| Papanicolaou Test, Year | Access to Health Care | % |
|---|---|---|
| 2000 | None/emergency department | 80.5 |
| 2005 | None/emergency department | 79.4 |
| 2008 | None/emergency department | 78.0 |
| 2010 | None/emergency department | 80.6 |
| 2013 | None/emergency department | 80.2 |
| 2015 | None/emergency department | 78.5 |
| 2000 | Usual source | 87.7 |
| 2005 | Usual source | 86.7 |
| 2008 | Usual source | 86.8 |
| 2010 | Usual source | 85.9 |
| 2013 | Usual source | 84.1 |
| 2015 | Usual source | 83.4 |
| Mammogram, Year | % |
|---|---|
| 2000 | 77.2 |
| 2003 | 75.3 |
| 2005 | 74.5 |
| 2008 | 75.8 |
| 2010 | 75.9 |
| 2013 | 75.9 |
| 2015 | 74.2 |
| Colorectal Cancer, Women, Year | % |
| 2000 | 34.8 |
| 2003 | 38.3 |
| 2005 | 44.8 |
| 2008 | 52.7 |
| 2010 | 59.9 |
| 2013 | 60.1 |
| 2015 | 63.3 |
| Colorectal Cancer, Men, Year | Insurance | % |
|---|---|---|
| 2000 | Private | 35.4 |
| 2003 | Private | 40.9 |
| 2005 | Private | 46.5 |
| 20008 | Private | 55.2 |
| 2010 | Private | 62.6 |
| 2013 | Private | 59.2 |
| 2015 | Private | 63.9 |
| 2000 | Public | 32.9 |
| 2003 | Public | 42.4 |
| 2005 | Public | 43.4 |
| 2008 | Public | 45.4 |
| 2010 | Public | 55.5 |
| 2013 | Public | 58.4 |
| 2015 | Public | 59.4 |
| 2000 | Uninsured | 22.2 |
| 2003 | Uninsured | 29.3 |
| 2005 | Uninsured | 31.6 |
| 2008 | Uninsured | 34.3 |
| 2010 | Uninsured | 36.2 |
| 2013 | Uninsured | 45.5 |
| 2015 | Uninsured | 48.5 |
| PSA Test, Year | % |
|---|---|
| 2000 | 41.8 |
| 2003 | 44.4 |
| 2005 | 42.6 |
| 2008 | 45.6 |
| 2010 | 43.4 |
| 2013 | 36.4 |
| 2015 | 37.3 |

