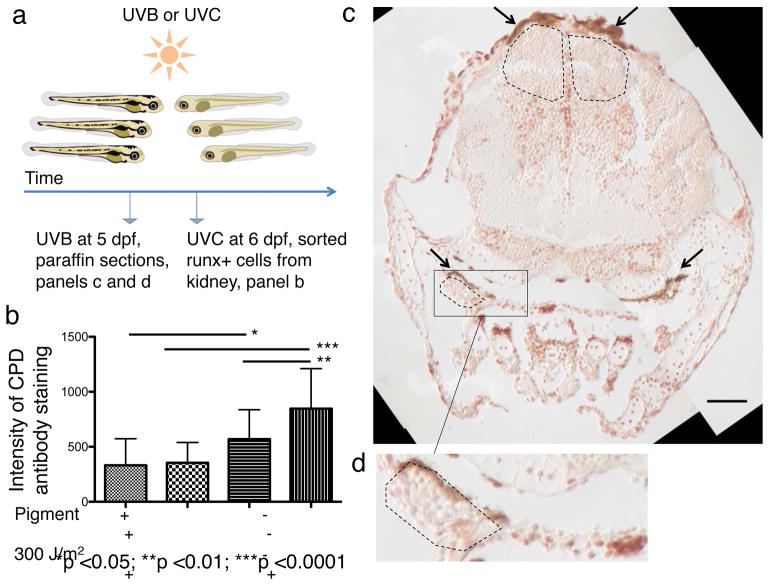
Figure 2. Melanocytes protect HSPCs from UV-induced DNA damage.
(a) Experimental layout. (b) Quantification of immunostain intensity per cell; statistics: ANOVA and post-hoc Bonferroni’s multiple comparison test, data are mean with s.d. (HSPCs from 5 kidneys for each condition; n=45, 33, 16, and 33 isolated cells, respectively); for dot plot see Extended Data Fig. 2b. (c) anti-CPD immunostain of a pigmented irradiated fish (transverse paraffin section). Black arrows indicate melanocytes. Dashed black lines indicate areas below the melanocytes with only few CPD+ nuclei. Scale bar represents 50 μm. (d) Magnification of the indicated area (thymus) in Fig. 2c.

