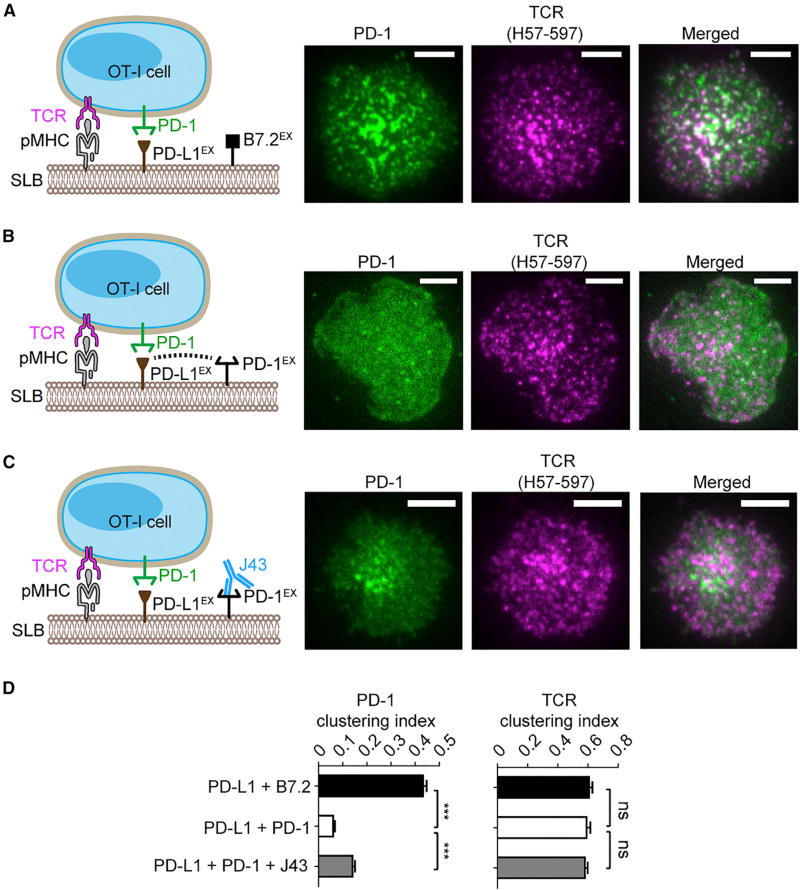
Figure 5. Cis-PD-1 Inhibits the Ability of PD-L1 to Trigger PD-1 Microclusters in CD8+ T Cells.
(A) A cell-bilayer assay showing that ligand-functionalized SLB triggers TCR and PD-1 clusters in OT-I CD8+ cells. PD-1–mCherry transduced OT-I cells, labeled with TCR-β antibody (H57-597*AF647), were plated on an SLB attached with peptide (SIINFEKL)-linked MHC-I H2Kb (pMHC), B7.2EX, and PD-L1EX (see cartoon on the left and STAR Methods for details). Shown on the right are representative TIRF images of PD-1–mCherry (rendered in green) and H57-597*AF647 (rendered in purple, indicating TCR distribution) 30 s after the cell-bilayer contact.
(B) Same as (A), except B7.2EX was replaced with equivalent concentrations of PD-1EX on the SLB. The pMHC/PD-L1EX/PD-1EX reconstituted SLB was plated with PD-1–mCherry transduced OT-I (see cartoons on the left). Representative TIRF images of PD-1–mCherry and H57-597*AF647 are shown on the right.
(C) Same as (B), except PD-1EX was preincubated with blockade antibody J43 (see cartoons on the left). Representative TIRF images of PD-1–mCherry and H57-597*AF647 are shown on the right.
(D) Bar graphs showing the clustering index of PD-1 and TCR in each condition (A–C). Data are the means ± SEM of at least 20 cells from three independent replicates.
Scale bars, 5 µm.

