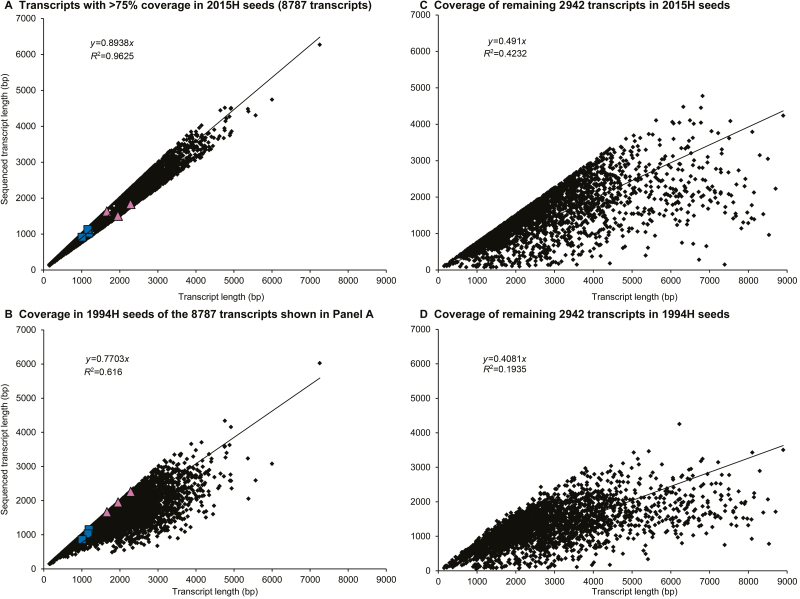
Fig. 2.
Comparison of reference and sequenced transcript lengths in the 11729 transcripts occurring in all 10 samples. (A) Sequenced transcript lengths in 2015H samples for transcripts where the read alignments from 2015H samples covered at least 75% of the reference transcript (8787 transcripts). (B) Sequenced transcript lengths for the same 8787 transcripts in 1949H samples. The six transcripts chosen for qPCR analysis are shown as blue squares (‘intact’ transcripts, Fig. 5 region A) or pink triangles (‘degradation-prone’ transcripts, Fig. 5 region B). (C, D) Sequenced transcript lengths for the remaining 2942 transcripts are shown in 2015H samples (C) and 1994H samples (D). A significant linear correlation between actual and sequenced transcript length exists in all cases, with the strongest correlation in (A).

