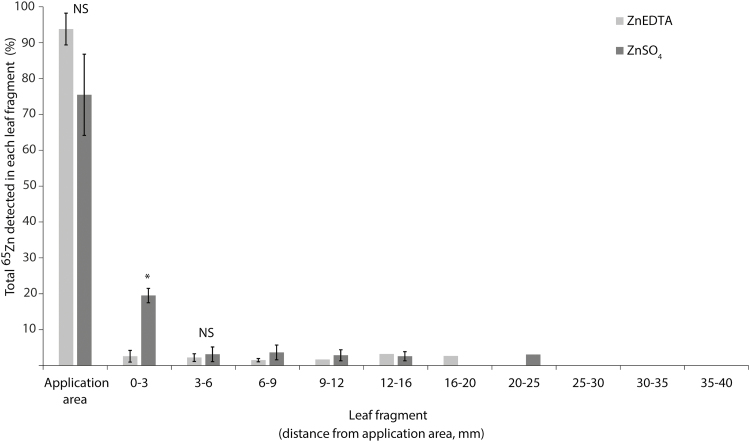
Fig. 1.
Distribution of 65Zn in leaves following foliar application of ZnEDTA and ZnSO4. The calculated mass of 65Zn in each leaf fragment is presented as the mean percentage (±1SD, n=4) of the total mass of 65Zn in the leaf (i.e. the total of all columns equals 100%). The asterisk indicates a significant difference between ZnEDTA and ZnSO4 for that leaf fragment (P=0.0009); NS, not significantly different. Statistical tests could only be applied to the first three leaf fragments (i.e. application area of 6 mm) due to unequal sample sizes for the remaining fragments as 65Zn was below the detection limit in some samples. Therefore, statistical tests would not be conclusively, or reliably, detected. The first bar represents the 20 mm of leaf tip that was dipped in fertilizer. Error bars are not shown for leaf fragments where 65Zn was only detected in one or two of the four replicates.

