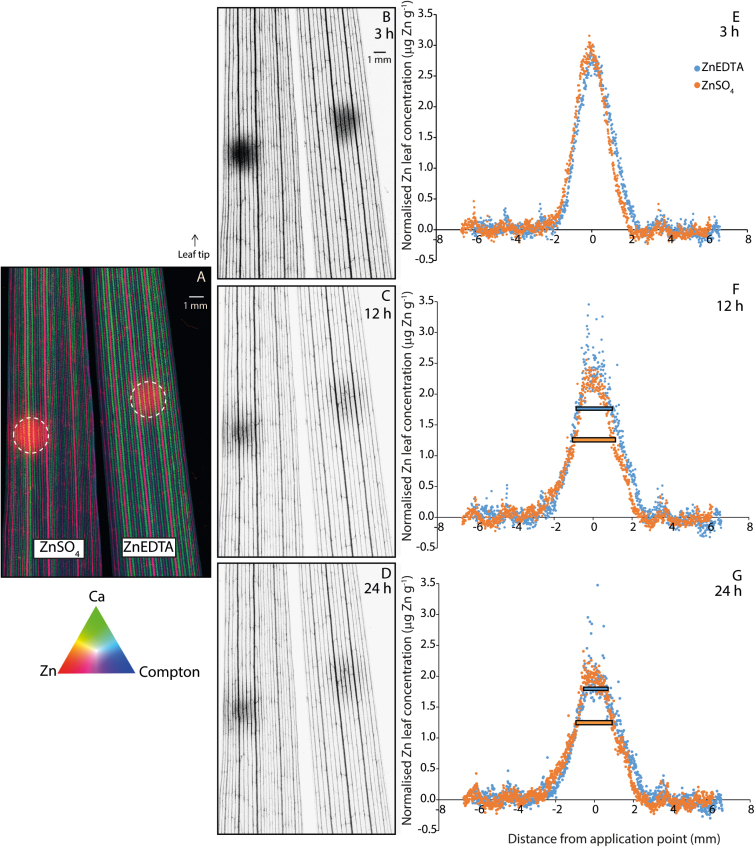
Fig. 2.
XFM time series experiment (XFM Experiment 1) on living wheat leaves (A–G). The Zn was applied to the leaves at t=0 h for a total of 3 h, with the unabsorbed Zn remaining in the droplet removed before analysis, where the dashed circle on the leaves (A) shows the size of the droplet. The XFM scans were conducted after 3 h (i.e. immediately after removal of the remaining unabsorbed Zn) (A, B), 12 h (9 h after removal) (C), and 24 h (21 h after removal) (D). In (A), the data are presented as a tricolour image, showing the elemental distribution of Zn (red), Ca (green), and Compton (blue) 3 h after droplet application of ZnSO4 and ZnEDTA (A). The data in (B), (C), and (D) are greyscale images. Data shown in (E), (F), and (G) correspond to the data extracted from (B), (C), and (D). After 12 h and 24 h, the distribution of ZnSO4 was broader than that of ZnEDTA, as indicated by the horizontal bars inserted at 50% of the maximum Zn concentration (F and G). XFM data were normalized to the background concentrations of Zn in leaves. For each image, the leaf exposed to ZnSO4 is on the left and the leaf exposed to ZnEDTA is on the right, with the size of the imaged area being 13.5 mm×20 mm.

