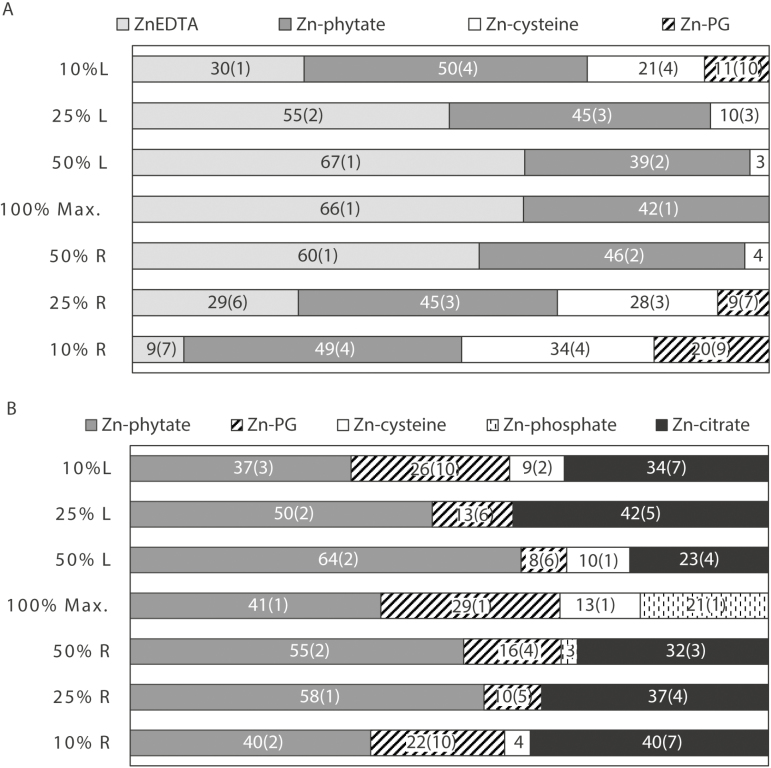
Fig. 5.
Distribution of Zn species in wheat leaves treated with foliar applications of ZnEDTA (A) or ZnSO4 (B). The maximum signal intensity (100% maximum) corresponds to the fertilizer application point. XANES maps were collected at 50, 25, and 10% of the maximum signal intensity along the longitudinal axis of the leaf from left (L) to right (R) (e.g. from 10% L to 10% R of the fertilizer application point, respectively). The percentage variation in the calculated values (standard errors) is shown in parentheses. For percentage contributions that were <5%, the associated standard errors were <1% and are shown in Supplementary Table S1 for clarity.

