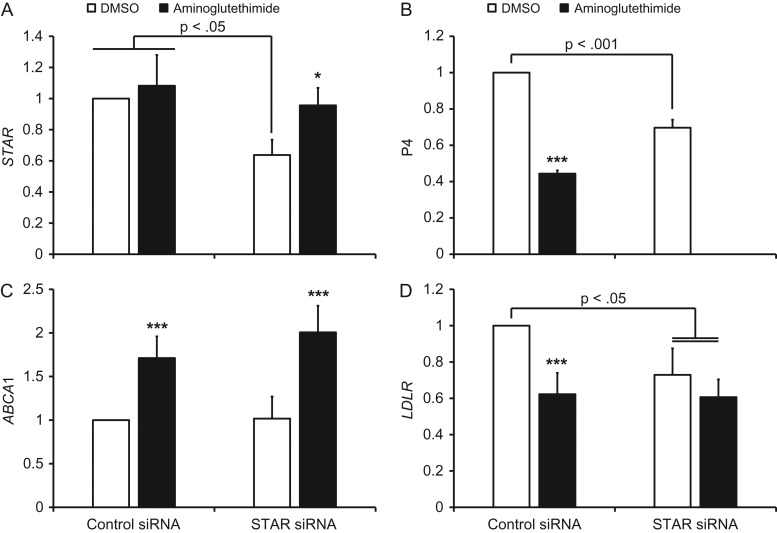
Figure 5.
The effect of STAR knockdown on aminoglutethimide-induced changes in LXR and SREBP2 target gene mRNA expression in human luteinized granulosa cells. Panel (A) displays QPCR data for STAR and panel (B) is P4 secretion. Panels (C and D) are ABCA1 and LDLR mRNA expression in response to aminoglutethimide, respectively. For each chart, data are displayed as the fold change relative to DMSO-treated, control siRNA-transfected cells. Error bars indicate one SEM. Brackets indicate significant differences between the indicated groups due to STAR siRNA transfection, and asterisks denote significant differences due to aminoglutethimide within the respective siRNA transfection group; *P < 0.05, ***P < 0.001.

