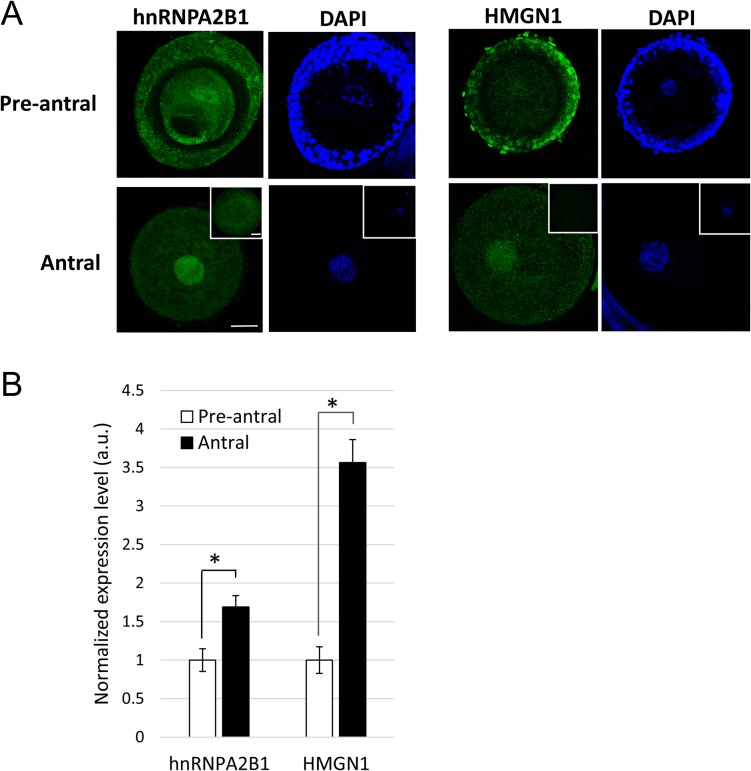
Figure 4.
Presence of hnRNPA2B1 and HMGN1 in GVs from pre-antral and antral oocytes. (A) Total fluorescence within a GV was imaged and (B) quantified after immunostaining. Non-immune IgG from mouse and rabbit (insets) were included as negative controls. Bars = 30 μm. Average fluorescent values from the pre-antral groups were set as 1. Values are means ± SEM. *P < 0.05.

