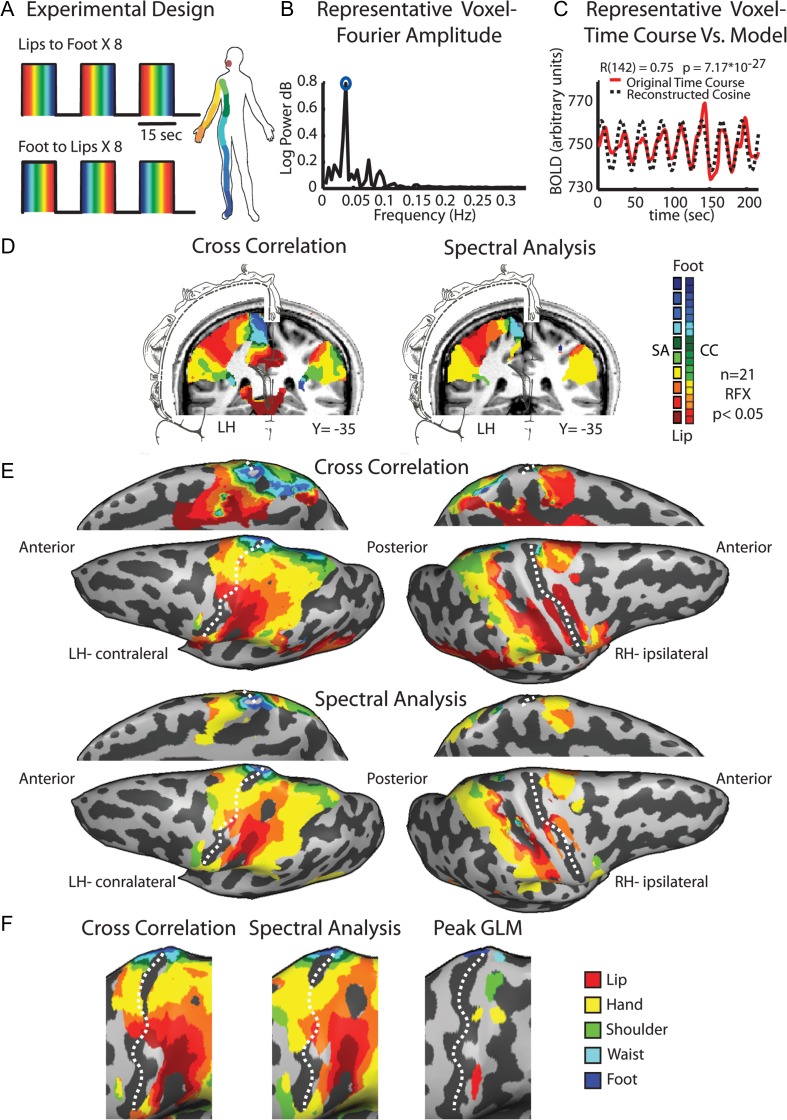
Figure 1.
Experimental design and phase-locked mapping of the primary somatosensory homunculus. (A) The experimental design of the periodic experiment, comprising 8 cycles of whole-body passive tactile stimulation from lips to toe and 8 reversed cycles from toe to lips. (B) The Fourier amplitude in various frequencies of a typical voxel from the postcentral gyrus. High amplitude at the repetition frequency of the experiment (marked by a blue circle) indicates that this voxel was responsive to touch. (C) The amplitude at the repetition frequency and the phase value were derived from the Fourier analysis of the time course in a given voxel, and were used to build a cosine, which served as a model of activation for this voxel. (D) Full-body group maps of the homunculus in S1 obtained by cross-correlation and spectral analysis are shown on a coronal slice with illustration of Penfield's somatosensory homunculus (adapted from Penfield and Rasmussen, 1950). (E) The same maps as is in (D) are presented on an inflated brain reconstruction in lateral and medial views. Note that in the medial view images, the hemispheres were flipped for illustrative purposes and alignment with the maps on the lateral view. (F) Magnification of the primary somatosensory cortex showing the similarity between the maps obtained by cross-correlation and spectral analysis as well as the peak activation of each body segment obtained by GLM analysis. Dashed line marks the central sulcus.

