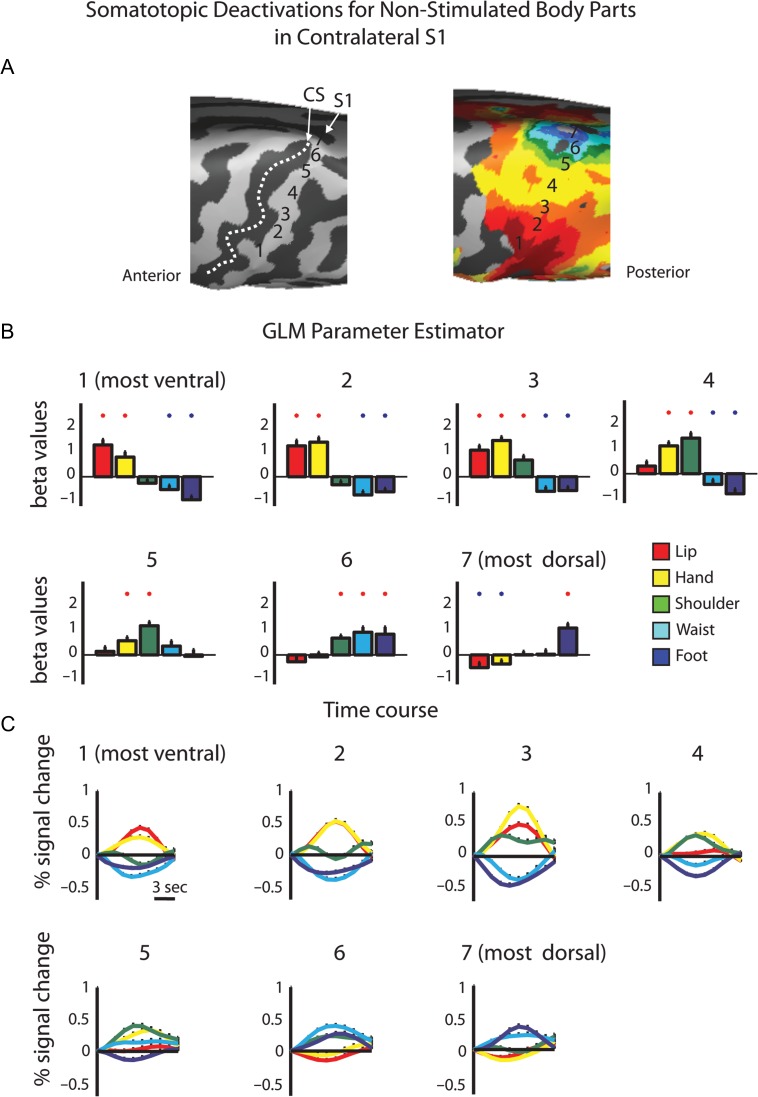
Figure 2.
ROI GLM analysis of positive and negative BOLD responses in the contralateral S1. (A) Consecutive ROIs were defined along the contralateral hemisphere from the ventral to the dorsal PCG. (B) GLM parameter estimators extracted from the contrast of each body segment versus baseline rest. Red and blue asterisks denote significant activation and deactivations, respectively (P < 0.05). (C) Average time courses in the same ROIs demonstrate the mix pattern of positive and negative BOLD along the contralateral primary somatosensory homunculus.

