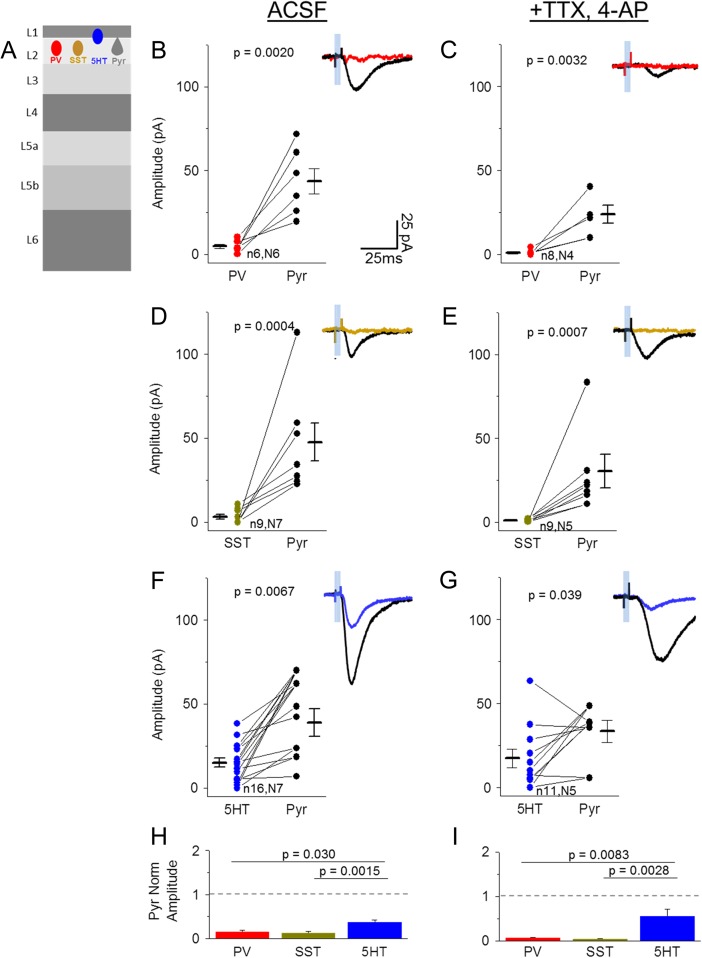
Figure 3.
Direct synaptic input from POm onto 3 major interneuron classes in L2. (A) Schematic of experiment. Light-evoked EPSCs were recorded in labeled inhibitory neurons (PV-, SST-, 5HT-Cre X Ai3) and Pyr neurons in L2 of POm-ChR2 injected animals. (B,C) Comparison of peak (within 50 ms stim onset) POm-evoked EPSC amplitude (average, 10 trials) of a PV cell and nearby Pyr neuron (<300 um apart) in control ACSF (B) and TTX, 4-AP (C). Sample trace shows PV (red) and Pyr (black) average response to 5 ms light pulse in same slice. (D,E) POm-evoked responses of SST (yellow) and nearby Pyr (black) neurons in ACSF (D) and TTX, 4-AP (E). (F,G) POm-evoked responses of 5HT (blue) and nearby Pyr (black) neurons in ACSF (F) and TTX, 4-AP (G). (H,I) Average of inhibitory neuron response amplitude normalized to nearby Pyr neurons in rACSF (H, ANOVA P-value: 0.0053) and TTX, 4-AP (I, ANOVA P-value: 0.0049). N values correspond to values in B–G. Note that inhibitory neurons are compared to multiple Pyr neurons when more than 1 Pyr neuron was recorded in the same slice.

