Figure 4.
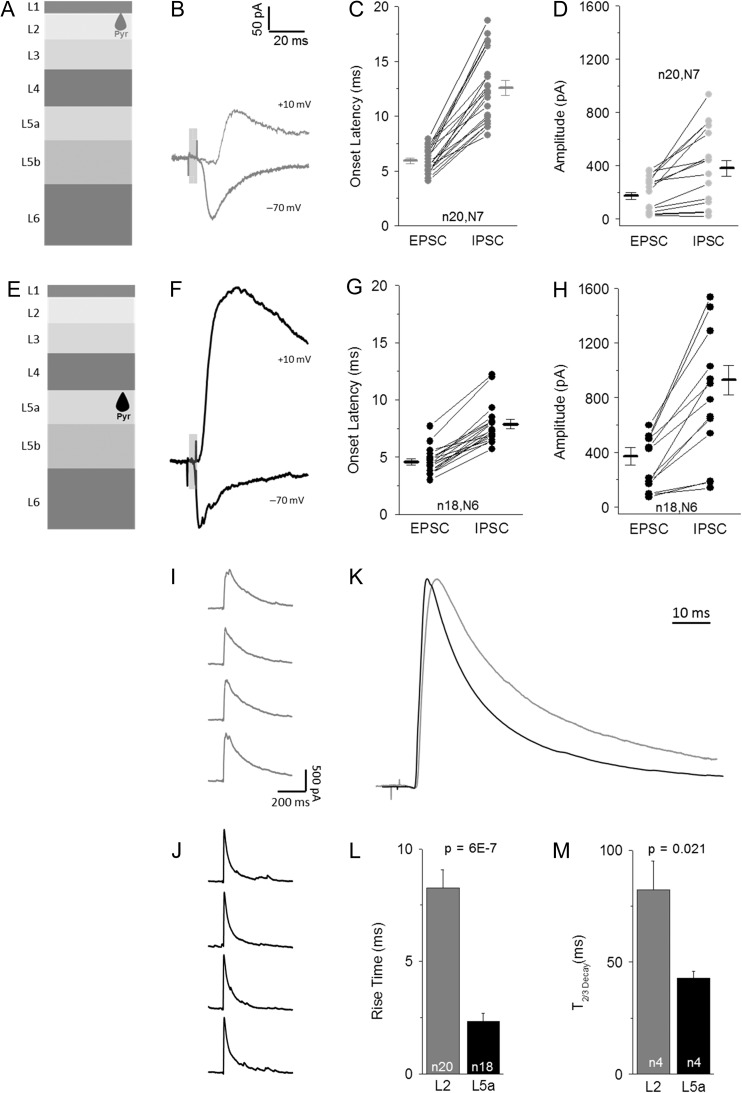
POm-evoked disynaptic inhibition is larger and faster in L5 Pyr neurons. (A) Schematic of L2 targeted Pyr neurons. (B) Example traces of average POm-evoked EPSC (−70 mV) and IPSC (+10 mV) responses. (C) Onset latency of POm-evoked EPSCs and IPSCs for L2 Pyr cells. Connected values for same cell. (D) Peak amplitude (<50 ms stim onset) of average EPSC and IPSC response for L2 Pyr neurons, connected values from same cell. (E–H) Example POm-evoked EPSC and IPSC (F), onset latency (G) and peak amplitude (H) for L5 Pyr neurons, same as A–D. (I,J) Consecutively recorded IPSCs in a L2 (I) and L5 (J) reveal kinetics and late-onset events. (K) Average of all L2 (gray) and L5 (black) IPSCs following minimal stimulation reveal differences in activation rate and duration of inhibition. Traces peak-scaled and aligned to rise. (L,M) Quantification of 10–90% rise time (L) and decay time (M, Time to 2/3 decay) for POm-evoked IPSCs is L2 (gray) and L5 (black) Pyr neurons. Ns are different in (L) and (M) due to inability to calculate decay with multiple pulses in some experiments.

