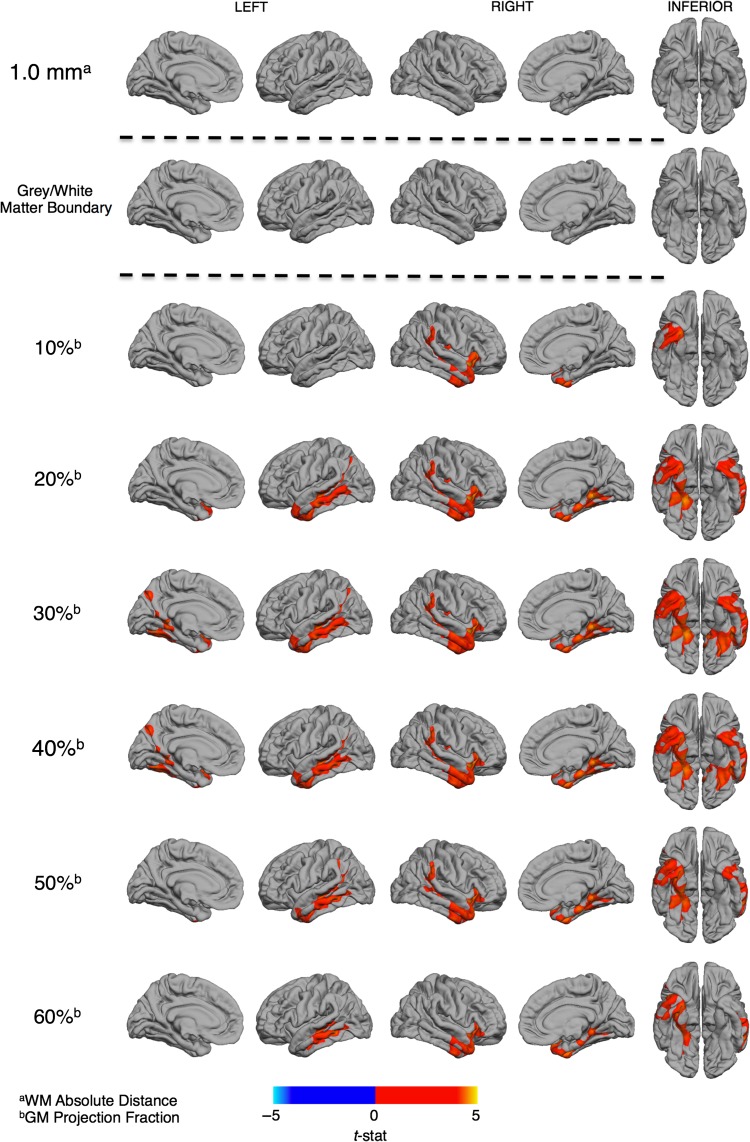
Figure 3.
Regional differences in gray (GMI) and white matter (WMI) signal intensities in ASD. Individuals with ASD showed no significant differences in WMI (RFT, P < 0.5) measured at 1 mm subjacent to the gray–white matter boundary (superscript a) nor tissue intensities measured at the boundary. Significantly increased GMI (RFT, P < 0.5) was observed across all projection fractions (superscript b) within the cortical sheet in ASD participants. The statistical and spatial extent of these increases in GMI were most evident at the 30% projection fraction and incorporated 1) the bilateral anterior temporal lobes and the left middle temporal gyrus, 2) the right temporo-parietal junction, and 3) the bilateral fusiform and entorhinal cortex. See Table 2 for statistical details.

