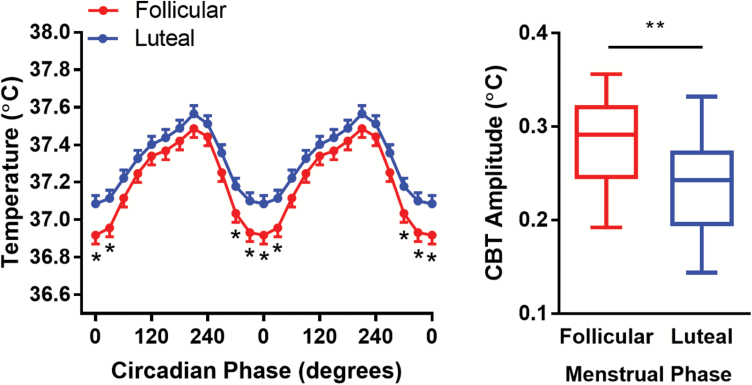
Figure 4.
Core body temperature in women in the luteal or follicular phases of the menstrual cycle. (A) CBT profiles for follicular (red) and luteal (blue) women. Data were aligned with CBT minimum for every individual as 0°. Asterisks indicate significant comparisons (p < 0.05). (B) Box-plots of CBT amplitude in follicular and luteal women. Whiskers show the minimum and maximum values.

