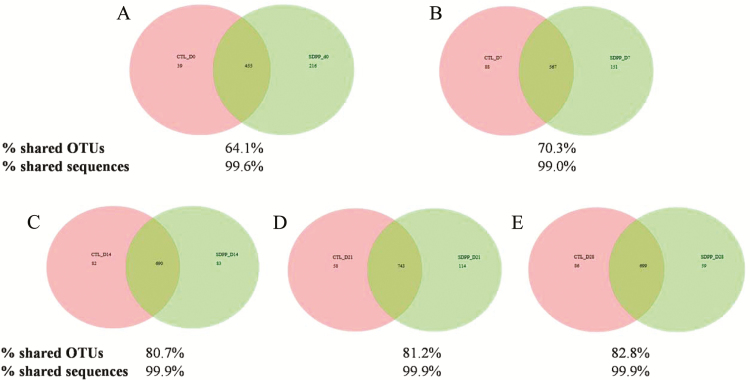
Figure 2.
Distribution of core OTUs in pigs fed control and SDPP diets on d 0, 7, 14, 21, and 28 postweaning (Panels A, B, C, D, and E, respectively). Proportion of shared OTUs was calculated by number of shared OTUs divided by total OTU richness of two groups at a timepoint. Proportion of shared sequences was calculated by number of shared sequences divided by total sequences of two groups at a timepoint.

