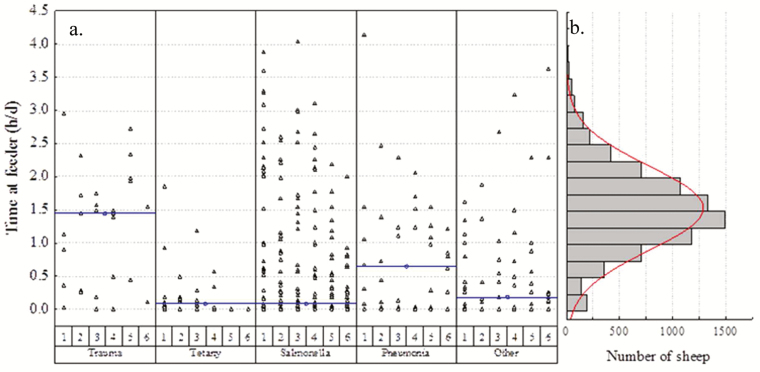
Figure 3.
Time spent at the feeder (h d−1) for sheep (a) that died from different causes (trauma n = 5, tetany n = 9, testing positive for salmonella, pneumonia n = 7, other n = 15). Each triangle represents an individual animal. The horizontal lines represent medians. (b) Histogram of the time spent at the feed trough (h d−1) averaged over the first 6 d for sheep that were alive at exit from the feedlot.

