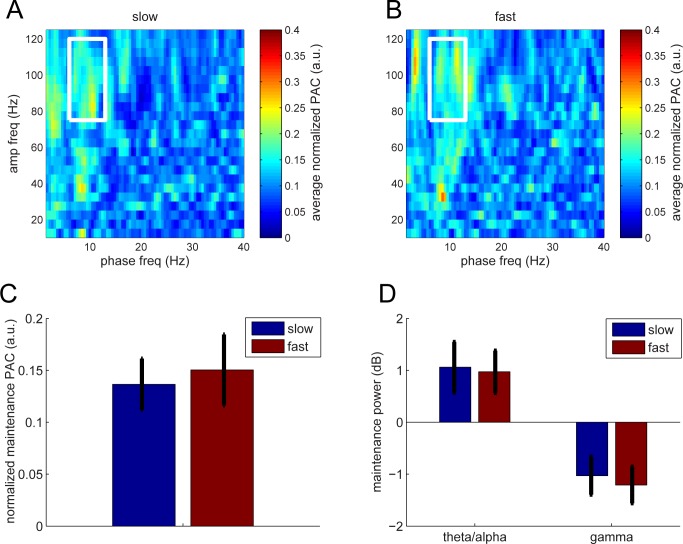
Fig 5. CFC during maintenance.
(A,B) CFC in trials with slow or fast RT. (C) Average CFC (PAC) over the white box of A and B. There was no difference with respect to slow and fast RTs. (D) Theta/alpha and gamma power during maintenance. There was no difference with respect to fast and slow RTs. Error bars represent SEM. Underlying data available at http://orion.bme.columbia.edu/jacobs/data/. a.u., arbitrary unit; CFC, cross-frequency coupling; PAC, phase–amplitude coupling; RT, response time

