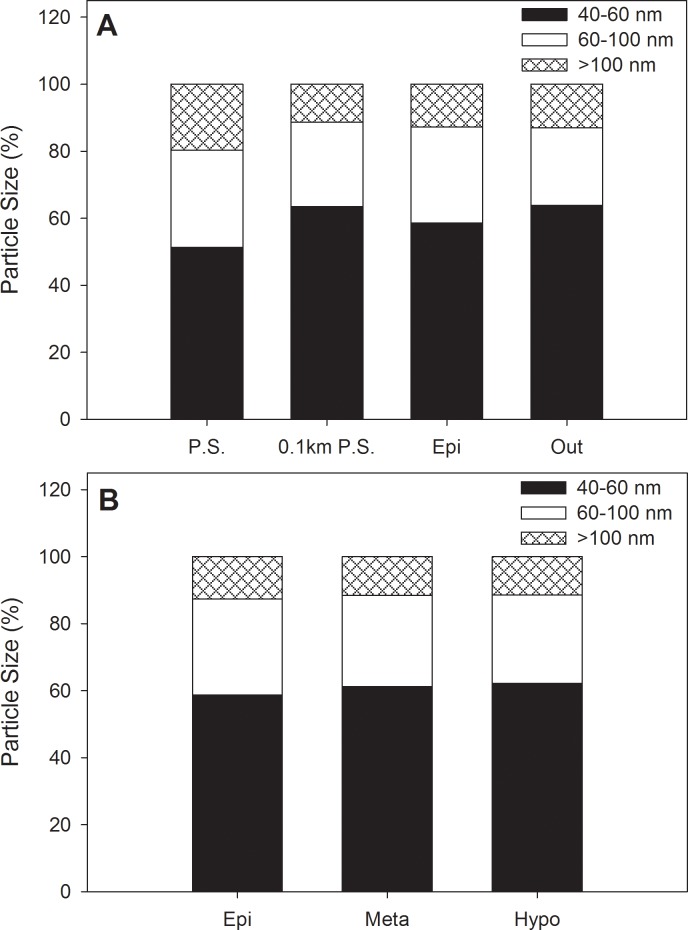
Fig 1. Mean annual particle size fractions across sampling site.
Size distributions are presented as percent of total particles detected by averaging temporal intervals. Sites are presented as a surface horizontal gradient from the addition site to the lake outflow (A) and vertically within in the lake at the center buoy location (B). Site abbreviations are the following: Point Source (P.S)., 0.1km from the point source (0.1 km P.S.), littoral site near lake outflow (Out), epilimnion (Epi), metalimnion (Meta), and Hypolimnion (Hypo).

