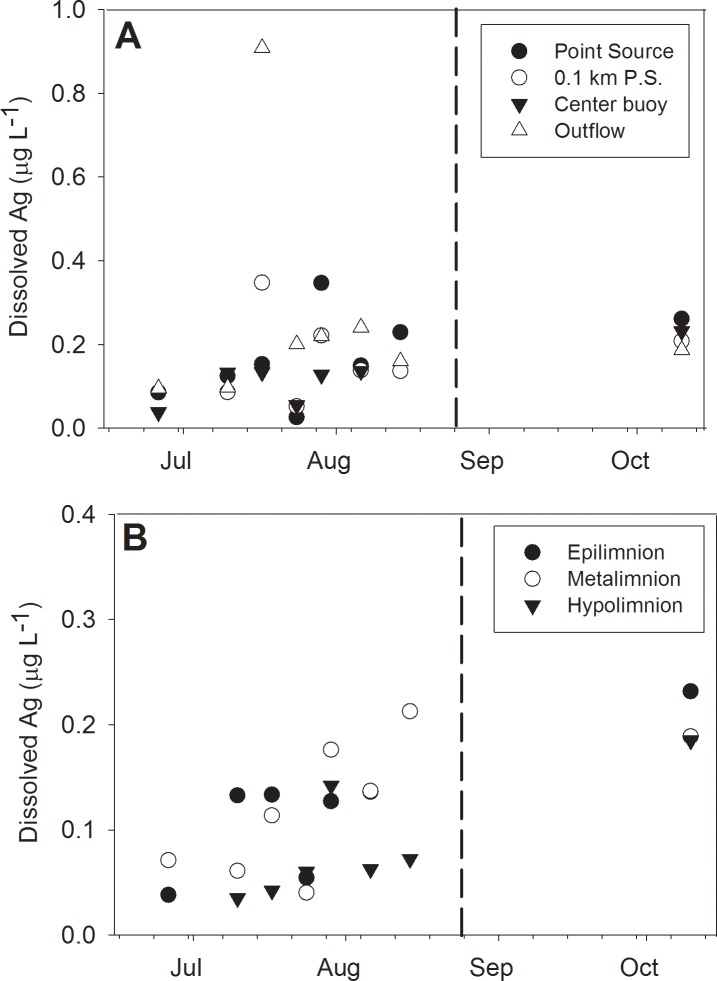
Fig 3. Spatial distribution of dissolved Ag concentrations (μg L-1).
Dissolved Ag is presented as: A. horizontal and B. vertical lake gradients after AgNP addition in 2014. Dissolved Ag was determined during sp-ICP-MS as denoted by changes to background Ag content. Vertical dashed lines represent the fall turnover date in the lake.

