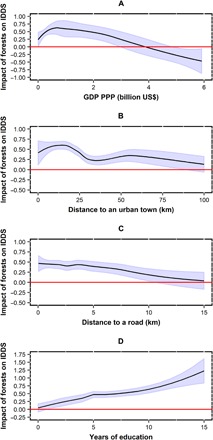
Fig. 4. Heterogeneity of impacts of forests on dietary diversity.

(A) Variation of impact with community GDP. (B) Moderating effect of distance to the nearest urban town. (C) Moderating effect of distance to the nearest road. (D) Moderating effect of the education of the head of household. Y axis represents the difference in dietary diversity (IDDS) between forest and similar nonforest households. Blue bands, 95% confidence intervals.
