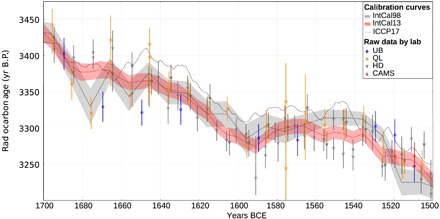
Fig. 2. IntCal raw data with IntCal13 and IntCal98 curves.

Raw determinations of multiyear blocks of north European oak making up IntCal13, 1700–1500 BCE with the derived IntCal13 curve. Comparison with the IntCal98 curve provides an example of how the addition of extra data and changes in the statistical methodology used to produce the curve has changed the shape over the years. The dashed line shows the midpoint of the ICCP17 curve, which is less offset from IntCal98.
