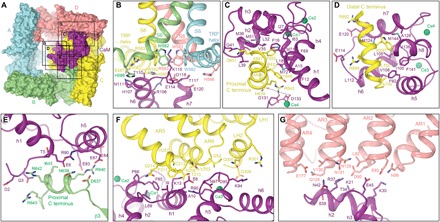
Fig. 2. Contact interfaces between CaM and TRPV6.

(A) Surface representation of rTRPV6-CaM viewed intracellularly with TRPV6 subunits and CaM colored similarly to Fig. 1. Boxes indicate rTRPV6-CaM interfaces expanded in (B) to (G). (B to G) Interfaces between CaM and different regions of rTRPV6, with residues involved in rTRPV6-CaM binding shown as sticks and calcium ions as green spheres.
